13. K modeling#
13.1. Characteristics of modeling#
Compression - traction with the law parameter GLRC_DM: ALPHA_C =100.
\(\mathrm{A6}\)
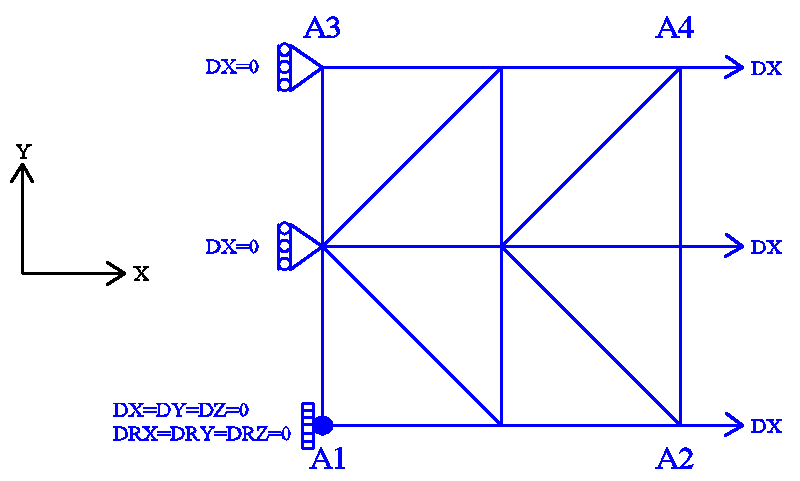
Figure 13.1-a: mesh and boundary conditions.
Modeling: DKTG
Boundary conditions:
Embedding in \({A}_{1}\);
\(\mathrm{DX}=0.0\) and \(\mathrm{DRY}=0.0\) on the \({A}_{1}-{A}_{3}\) edge;
\(\mathrm{DX}={U}_{0}\times f(t)\) on the \({A}_{2}-{A}_{4}\) edge;
where \({U}_{0}=2.0\times {10}^{-3}m\) and \(f(t)\) represent the amplitude of cyclic loading as a function of the (pseudo-time) parameter \(t\). To properly verify the model, a loading cycle is considered as follows:
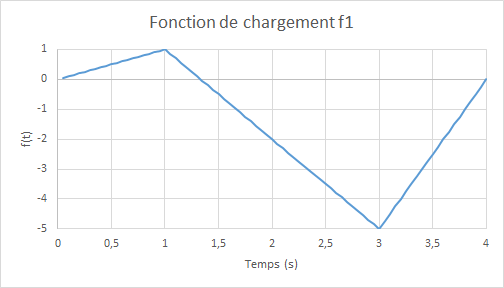
Figure 13.1-b: Load function \(f(t)\).
13.2. Characteristics of the mesh#
Number of knots: 9 Number of stitches: 8 TRIA3; 8 SEG2.
13.3. Tested values and results#
The average reaction forces along the axis \(\mathrm{Ox}\) and the average displacements along the axis \(\mathrm{Oy}\) en \(\mathrm{A2}-\mathrm{A4}\) obtained by multi-layer modeling (reference) and by that based on the model GLRC_DM are compared, in terms of relative differences; the tolerance is taken as an absolute value on these relative differences; the tolerance is taken as an absolute value on these relative differences:
Identification |
Reference type |
Reference value |
Tolerance |
|
Dissipation at \(t=\mathrm{0,05}\) |
|
0 |
5 10-2 |
|
Dissipation at \(t=\mathrm{0,75}\) |
|
254.9756 |
5 10-2 |
|
Dissipation at \(t=1\) |
|
346.5721 |
5 10-2 |
|
COMPRESSION \(t=\mathrm{0,25}\) |
||||
Relative difference in forces \(\mathrm{FX}\) |
|
4.046337 105 |
5 10-2 |
|
Relative difference in displacement \(\mathrm{DY}\) |
|
0 |
5 10-2 |
|
COMPRESSION \(t=\mathrm{1,0}\) |
||||
Relative difference in forces \(\mathrm{FX}\) |
|
5.204660 105 |
5 10-2 |
|
Relative difference in movement \(\mathrm{DY}\) |
|
0 |
0.1 |
|
COMPRESSION \(t=\mathrm{1,5}\) |
||||
Relative difference in forces \(\mathrm{FX}\) |
|
-2.687820 106 |
5 10-2 |
|
Relative difference in movement \(\mathrm{DY}\) |
|
0 |
0.1 |
|
TRACTION \(t=\mathrm{3,0}\) |
||||
Relative difference in forces \(\mathrm{FX}\) |
|
-4.175743 106 |
5 10-2 |
|
Relative difference in movement \(\mathrm{DY}\) |
|
0 |
0.1 |
|
TRACTION \(t=\mathrm{3,5}\) |
||||
Relative difference in forces \(\mathrm{FX}\) |
|
-2.087571 106 |
5 10-2 |
|
Relative difference in movement \(\mathrm{DY}\) |
|
0 |
0.1 |