11. Modeling I#
11.1. Characteristics of modeling#
Pure alternating flexure.
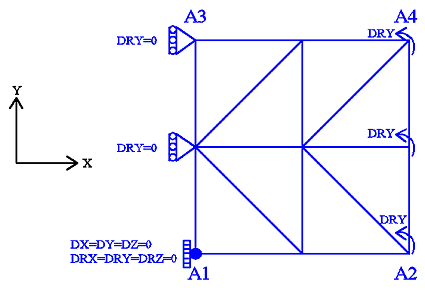
Figure 11.1-a: mesh and boundary conditions
Modeling: DKTG
Boundary conditions:
\(\mathrm{DRY}=0.0\) on the \({A}_{1}-{A}_{3}\) ridge
\(\mathrm{DRY}={R}_{0}\times f(t)\) on the \({A}_{2}-{A}_{4}\) edge,
where \({R}_{0}=3.0\times {10}^{-2}\) and \(f(t)\) is the magnitude of the cyclic loading as a function of the (pseudo-time) parameter \(t\).
To verify the model, consider the following loading function:
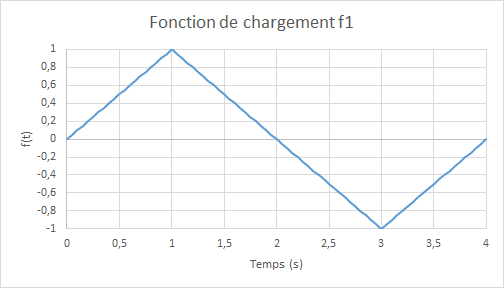
Figure 11.1-b: loading function
11.2. Characteristics of the mesh#
Number of knots: 9
Number of stitches: 8 TRIA3; 8 SEG2.
11.3. Modeling DHRC#
The models corresponding to high stress levels allow the validation of model DHRC. This model is in fact able to represent the relative slip between the reinforcing bars and the surrounding concrete during high levels of stress. H modeling then compares the results obtained for model DHRC with those of models GLRC_DM and EIB. The parameters chosen for GLRC_DM are then adjusted according to the parameters identified in DHRC.
11.3.1. Identifying parameters#
Model DHRC uses a large number of parameters resulting from an automated identification carried out prior to the structure calculation. This identification is based on a periodic representative elementary volume representing a section of the reinforced concrete plate, based on the periodicity of the reinforcement grid.
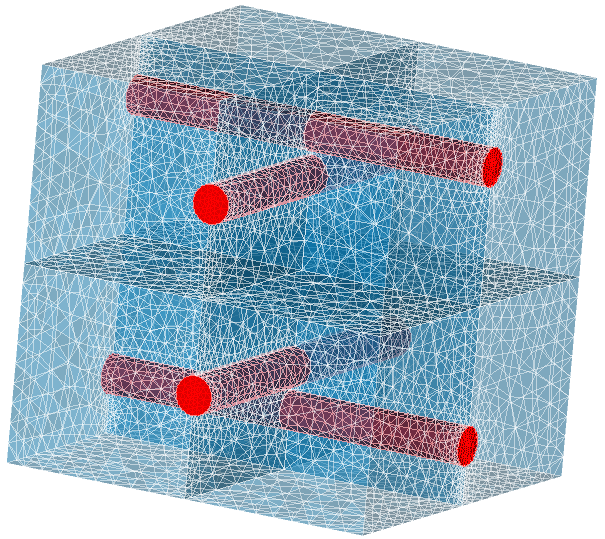
Figure 11.3-a : mesh e of the plate section for identifying the parameters of DHRC
The mesh shown in the thus represents a section of the studied plate of \(10\times 10\times 10{\mathit{cm}}^{3}\) with steels of diameter \(10\mathit{mm}\) corresponding to a reinforcement rate for each reinforcing sheet of \(8.0\times {10}^{-4}{m}^{2}/m\).
The properties of the materials selected for identification are summarized in the table below:
\({E}_{a}\), \(\mathrm{MPa}\) |
|
|
, |
|
|
|
|
|
, |
, |
, |
, |
, \({\sigma }_{d}\) \(\mathrm{MPa}\) \({\tau }_{\mathrm{crit}}\) \(\mathrm{MPa}\) |
|||
200,000 |
0.2 |
32 308 |
32 308 |
0.2 |
0.2 |
0.04 |
1.9 |
0.8 |
1.7 |
1.7 |
1.6 |
11.3.2. Characteristics of modeling#
Apart from the parameters, modeling with model DHRCrepose on the same mesh and the same characteristics as that with model GLRC_DM.
11.4. Tested values and results#
The average reaction moments along the axis \(\mathit{Oy}\) and the average rotations along the axis \(\mathit{Ox}\) en \(\mathrm{A2}-\mathrm{A4}\) obtained by multi-layer modeling (reference) and by those based on the models GLRC_DMetDHRC are compared, in terms of relative differences; the tolerance is taken as an absolute value on these relative differences; the tolerance is taken as an absolute value on these relative differences:
Identification |
Reference type |
Reference value |
Tolerance |
FLEXION POSITIVE - ELASTIQUE \(t=\mathrm{0,25}\) |
|||
Relative difference \(\mathit{MY}\) EIB - GLRC_DM |
|
-0.058930777941 |
1 10-6 |
Relative difference \(\mathit{DRX}\) EIB - GLRC_DM |
|
0.0140805136872 |
1 10-6 |
FLEXION POSITIVE - ENDOMMAGEMENT \(t=\mathrm{1,0}\) |
|||
Relative difference \(\mathit{MY}\) EIB - GLRC_DM |
|
-0.013517819448 |
1 10-6 |
FLEXION POSITIVE - DECHARGEMENT \(t=\mathrm{1,5}\) |
|||
Relative difference \(\mathit{MY}\) EIB - GLRC_DM |
|
-0.013517811534 |
1 10-6 |
FLEXION NEGATIVE — ELASTIQUE \(t=\mathrm{2,25}\) |
|||
Relative difference \(\mathit{MY}\) EIB - GLRC_DM |
|
0.237253648326 |
1 10-6 |
FLEXION NEGATIVE - ENDOMMAGEMENT \(t=\mathrm{3,0}\) |
|||
Relative difference \(\mathit{MY}\) EIB - GLRC_DM |
|
-0.018737973869 |
1 10-6 |
FLEXION NEGATIVE - DECHARGEMENT \(t=\mathrm{3,5}\) |
|||
Relative difference \(\mathit{MY}\) EIB - GLRC_DM |
|
-0.018737948559 |
1 10-6 |
Identification |
Reference type |
Reference value |
Tolerance |
FLEXION POSITIVE - ELASTIQUE \(t=\mathrm{0,05}\) |
|||
Relative difference \(\mathit{MY}\) DHRC - GLRC_DM |
|
0.053928832983 |
1 10-6 |
Relative difference \(\mathit{DRX}\) DHRC - GLRC_DM |
|
-0.1370655366 |
1 10-6 |
FLEXION POSITIVE - ENDOMMAGEMENT \(t=\mathrm{0,25}\) |
|||
Relative difference \(\mathit{MY}\) DHRC - GLRC_DM |
|
-0.067308303799 |
1 10-6 |
Relative difference \(\mathit{DRX}\) DHRC - GLRC_DM |
|
-0.385700593873 |
1 10-6 |
FLEXION POSITIVE - GLISSEMENT \(t=\mathrm{0,8}\) |
|||
Relative difference \(\mathit{MY}\) DHRC - GLRC_DM |
|
-0.095654243115 |
1 10-6 |
Relative difference \(\mathit{DRX}\) DHRC - GLRC_DM |
|
-0.480604508583 |
1 10-6 |
FLEXION POSITIVE - DECHARGEMENT \(t=\mathrm{1,5}\) |
|||
Relative difference \(\mathit{MY}\) DHRC - GLRC_DM |
|
0.0864374984569 |
1 10-6 |
Relative difference \(\mathit{DRX}\) DHRC - GLRC_DM |
|
0.599437578678 |
1 10-6 |
FLEXION BORN GATIVE - CHARGEMENT \(t=\mathrm{2,05}\) |
|||
Relative difference \(\mathit{MY}\) DHRC - GLRC_DM |
|
0.485367 |
1 10-6 |
Relative difference \(\mathit{DRX}\) DHRC - GLRC_DM |
|
0.174931 |
1 10-6 |
FLEXION BORN GATIVE - GLISSEMENT \(t=\mathrm{3,0}\) |
|||
Relative difference \(\mathit{MY}\) DHRC - GLRC_DM |
|
-0.027538330438 |
1 10-6 |
Relative difference \(\mathit{DRX}\) DHRC - GLRC_DM |
|
0.0420512601078 |
1 10-6 |
FLEXION BORN GATIVE - GLISSEMENT \(t=\mathrm{3,5}\) |
|||
Relative difference \(\mathit{MY}\) DHRC - GLRC_DM |
|
-0.027538305332 |
1 10-6 |
Relative difference \(\mathit{DRX}\) DHRC - GLRC_DM |
|
0.0420503578967 |
1 10-6 |
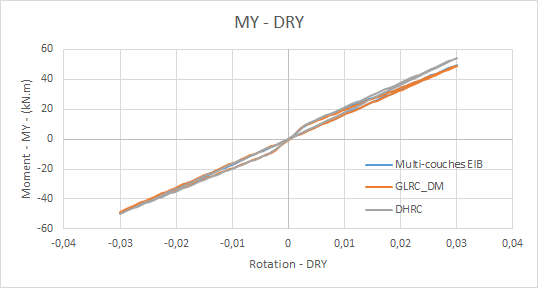
Comparative moment graphs \(\mathrm{MY}\) — rotation \(\mathrm{DRY}\) in alternating flexure for load \(f\) :: **
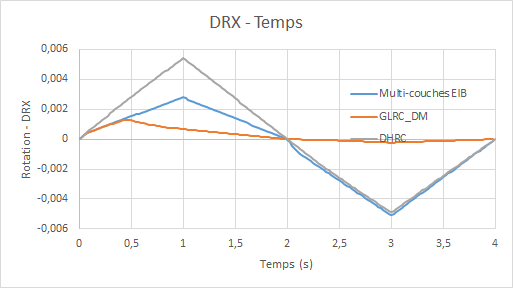
Comparative rotation graphs \(\mathrm{DRX}\) (due to the Poisson effect) as a function of time:
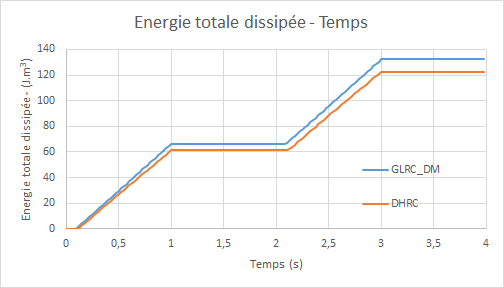
Diagrams of the evolution of the total energy dissipated by the models GLRC_DM and DHRC as a function of time:
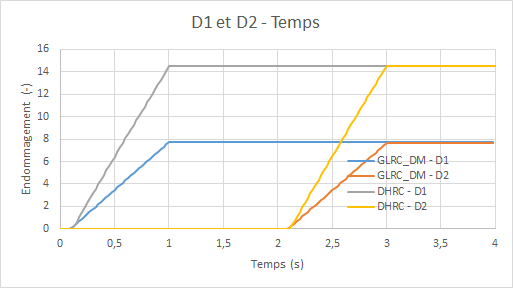
Diagrams of the evolution of damage for models GLRC_DM and DHRC (\({d}_{1}\) for the upper side and \({d}_{2}\) for the lower side) as a function of time:
11.5. notes#
The test case carried out here aims to test models GLRC_DM and DHRC under loads that are significant enough for the stiffness of the steels to effectively recover on the reference EIB.
This test case uses test case SSNS106B by adding the reference DHRC in order to compare the global model GLRC_DM with a model taking into account more energy dissipation via the representation of sliding mechanisms internal to the steel-concrete interface. We then notice on the moment-rotation curve that the answers given by the models GLRC_DM and DHRC differ from the answer given by the multi-layer modeling EIB. Indeed, the modeling of the flexural behavior is very affected by the position of the steels in the thickness of the plate and the consideration of an eccentricity of \(\mathrm{0,4}\mathit{cm}\) in the modeling EIB is only approximate since the embedding of the reinforcements and of \(\mathrm{0,1}\mathit{cm}\) for a half-plate thickness of \(\mathrm{0,5}\mathit{cm}\) and steels of diameter \(10\mathit{mm}\).
We can make the same remark as in § 10.5 on rotations \(\mathit{DRX}\), this time, in fact, the rotations, for the multi-layer model, are also calculated on concrete and therefore become zero once the ruin of the concrete is reached.
Moreover, it is observed on the evolution diagrams of the internal variables of damage, that positive bending leads to an evolution of the internal damage variable \({d}_{2}\) corresponding to the damage in the lower half of the plate and that negative bending leads to the evolution of the variable \({d}_{1}\); and this for the two models considered. This is in line with the expected physics of the problem, as the plate is mainly damaged in its tense part.