7. E modeling#
7.1. Characteristics of modeling#
Flexion-shear coupling in the plane.
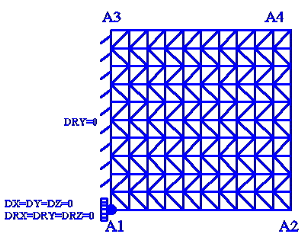
Figure 7.1-a: mesh
Modeling: DKTG. \(L=1.0m\).
Boundary conditions (see figure below):
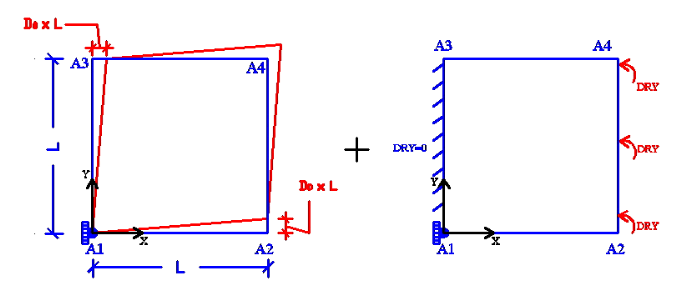
Figure 7.1-b: Boundary conditions
we impose an embedding in \({A}_{1}\), and
\({u}_{x}={D}_{0}\cdot y,{u}_{y}=0\) on edge \({A}_{1}-{A}_{3}\), \({u}_{x}=0,{u}_{y}={D}_{0}\cdot x\) and \(\mathrm{DRY}=0.0\) on edge \({A}_{1}-{A}_{2}\)
\({u}_{x}={D}_{0}\cdot y,{u}_{y}={D}_{0}\cdot L\) and DRY = \({R}_{0}\) × \(f(t)\) on edge \({A}_{2}-{A}_{4}\), \({u}_{x}={D}_{0}\cdot L,{u}_{y}={D}_{0}\cdot x\) on edge \({A}_{3}-{A}_{4}\),
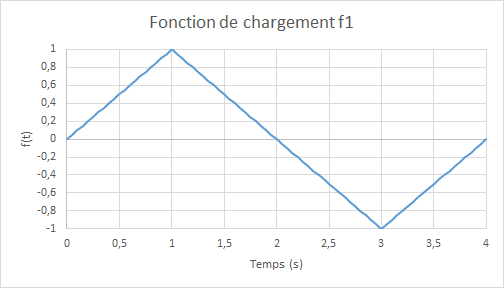
where \({D}_{0}=1.1{10}^{-4}\cdot f(t)\), \({R}_{0}=6.0{10}^{-3}\), and \(f(t)\) represent the magnitude of cyclic loading as a function of the (pseudo-time) parameter \(t\), defined as:
7.2. Characteristics of the mesh#
Number of knots: 121.
Number of stitches: 200 TRIA3; 40 SEG2.
7.3. Tested sizes and results#
The results obtained by modeling GLRC_DM are evaluated by non-regression tests at various times:
Identification |
Reference Type |
Reference Values |
Tolerance |
|
At t=1,0 |
||||
Movement \(\mathrm{DX}\) in \(\mathrm{A2}\) |
|
0 |
1 10-6 |
|
Move \(\mathrm{DZ}\) in \(\mathrm{A2}\) |
|
-3.0 10-3 |
1 10-4 |
|
Effort \({N}_{\mathrm{yy}}\) in \(\mathrm{A2}\) |
|
15058.8134864 |
1 10-4 |
|
Damage variable \(\mathrm{d1}\) in \(\mathrm{A1}\) |
|
1.178108 |
1 10-4 |
|
Damage variable \(\mathrm{d2}\) in \(\mathrm{A1}\) |
|
0.0 |
1 10-4 |
|
To \(t=\mathrm{2,8}\) |
||||
Move \(\mathrm{DX}\) in \(\mathrm{A4}\) |
|
-8.8 10-5 |
1 10-4 |
|
Move \(\mathrm{DZ}\) in \(\mathrm{A4}\) |
|
1.9504378 10-3 |
1 10-4 |
|
Effort \({N}_{\mathrm{yy}}\) in \(\mathrm{A4}\) |
|
-12047.0496585 |
1 10-4 |
|
Damage variable \(\mathrm{d1}\) in \(\mathrm{A1}\) |
|
1.178108 |
1 10-4 |
|
Damage variable \(\mathrm{d2}\) in \(\mathrm{A1}\) |
|
0.75196363 |
1 10-4 |
|
To \(t=\mathrm{3,0}\) |
||||
Damage variable \(\mathrm{d1}\) in \(\mathrm{A1}\) |
|
1.178108 |
1 10-4 |
|
Damage variable \(\mathrm{d2}\) in \(\mathrm{A1}\) |
|
1.162571 |
1 10-4 |
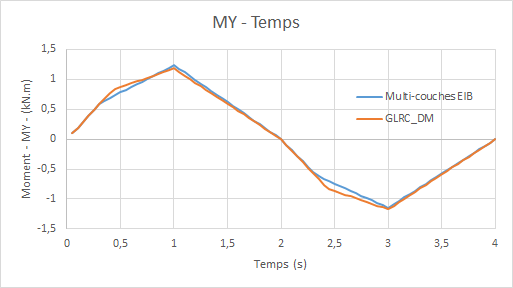
Comparative diagrams multilayer model-model GLRC_DMmoment flexing \({M}_{\mathit{yy}}\) as a function of time:
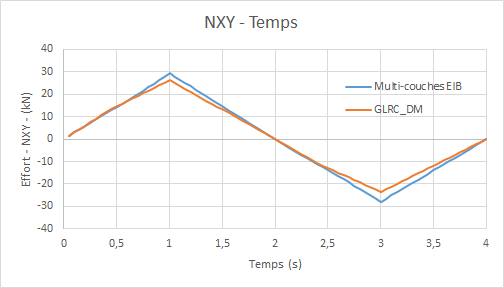
Comparative diagrams multilayer model-model GLRC_DMeffort cutting edge \({N}_{\mathit{xy}}\) as a function of time:
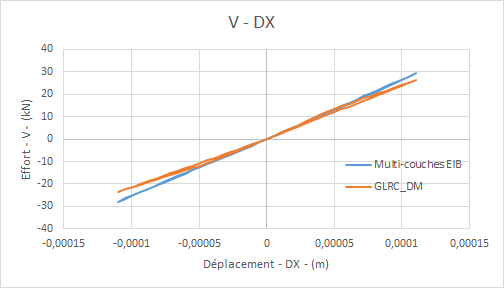
Comparative diagrams multi-layer model GLRC_DMde the shear force bending moment \({N}_{\mathit{xy}}\) as a function of the distortion:
Comparative diagrams multilayer model-model GLRC_DMdu bending moment \({M}_{\mathit{yy}}\) as a function of rotation:
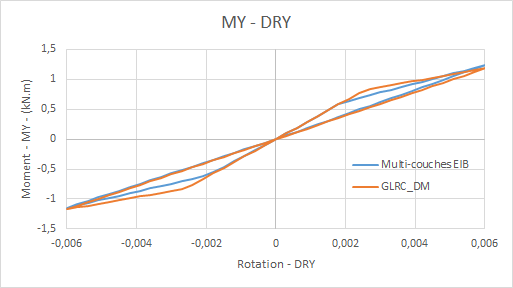
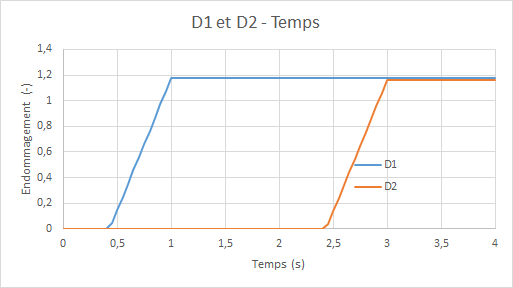
Diagram of the evolution of the damage of model GLRC_DM (\({d}_{1},{d}_{2}\)) over time:
We check, cf. [R7.01.32], that with the data from the test case, we have: \({k}_{0}=\mathrm{9,81138260345866}J/{m}^{2}\), hence the surface densities of energy dissipated:
Instant |
\({d}_{1}\) |
|
energy dissipated \(J/{m}^{2}\) |
|
\(t=\mathrm{2,0}s\) |
1.1781 |
0.0 |
11.5589 |
|
\(t=\mathrm{4,0}s\) |
1.178 |
1.161 |
1.1626 |
22.9653 |