4. B modeling#
4.1. Characteristics of modeling#
Pure alternating flexure.
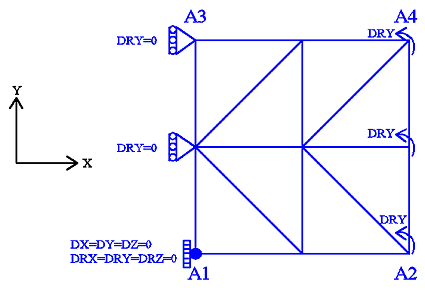
Figure 4.1-a: mesh and boundary conditions
Modeling: DKTG
Boundary conditions:
\(\mathrm{DRY}=0.0\) on the \({A}_{1}-{A}_{3}\) ridge
\(\mathrm{DRY}={R}_{0}\times f(t)\) on the \({A}_{2}-{A}_{4}\) edge,
where \({R}_{0}=6\times {10}^{-3}\) and \(f(t)\) is the amplitude of the cyclic loading as a function of the (pseudo-time) parameter \(t\), to properly verify the model, we consider three loading functions as:
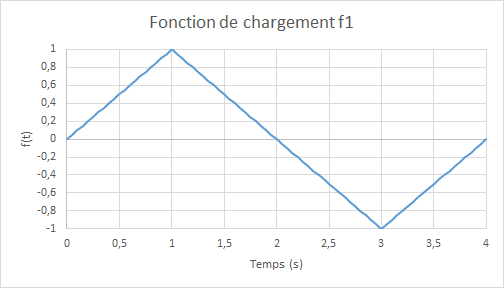
Figure 4.1-b: Negative Flexion, then Positive Bending |
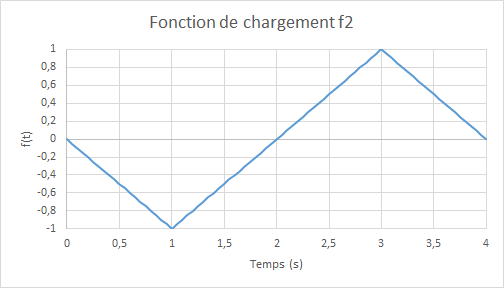
Figure 4.1-c: Positive Flexion, then Negative Flexion |
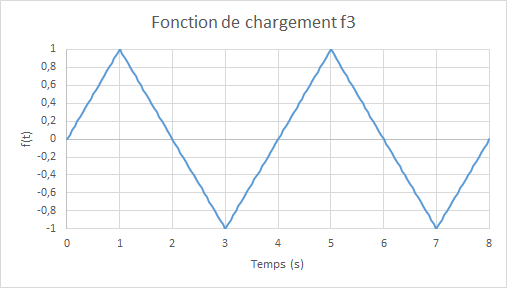
Figure 4.1-d: Two cycles of alternating flexure
Note: the extreme deformation of steels is: \(2.4\times {10}^{-3}\), i.e. below the transition to plasticity of the steels. Integration increment: \(0.05s\).
4.2. Characteristics of the mesh#
Number of knots: 9. Number of stitches: 8 TRIA3.
4.3. Simple analytics solution#
In addition to the reference calculation, a very simple analytical calculation is done to verify the model and the code. To do this, we consider a homogeneous beam whose material properties are the same as those of the homogeneous plate. The same boundary conditions are imposed on the beam. Then by considering the law of behavior under consideration (elastic that is damaged under tension and linear elastic under compression), we calculate the force MY corresponding to DRY imposed.
4.4. Tested quantities and results for the f1 loading function#
The average moments along the axis \(\mathrm{Oy}\) and the average rotations along the axis \(\mathrm{Ox}\) in \(\mathrm{A2}-\mathrm{A4}\) obtained by multi-layer modeling (reference) and by that based on the model GLRC_DM are compared, in terms of relative differences; some tolerances are taken in absolute value, others in relative values, others in relative values (from a non-regression value, they are then noted « R »), on these relative differences:
Identification |
Reference type |
Reference value |
Tolerance |
|
FLEXION NEG - PHASE CHAR. ELAS. \(t=\mathrm{0,25}\) |
||||
Relative moment difference \({M}_{\mathrm{yy}}\) |
|
0 |
5 10-2 |
|
Relative difference in rotations \(\mathrm{DRX}\) |
|
5.17840782 10-3 |
1 10-6 |
|
FLEXION NEG - PHASE CHAR. ENDO. \(t=\mathrm{1,0}\) |
||||
Relative moment difference \({M}_{\mathrm{yy}}\) |
|
0 |
7 10-2 |
|
Relative difference in rotations \(\mathrm{DRX}\) |
|
0.1490673 |
1 10-6 |
|
FLEXION NEG - PHASE DECHAR. ELAS. \(t=\mathrm{1,5}\) |
||||
Relative moment difference \({M}_{\mathrm{yy}}\) |
|
0 |
7 10-2 |
|
Relative difference in rotations DRX |
NON_REGRESSION |
0.1490673 |
1 10-6 |
|
FLEXION POS. - PHASE CHAR. ELAS. \(t=\mathrm{2,25}\) |
||||
Relative moment difference \({M}_{\mathrm{yy}}\) |
|
0 |
5 10-2 |
|
Relative difference in rotations \(\mathrm{DRX}\) |
|
0.2755444 |
1 10-6 |
|
FLEXION POS. - PHASE CHAR. ENDO. \(t=\mathrm{3,0}\) |
||||
Relative moment difference \({M}_{\mathrm{yy}}\) |
|
0 |
7 10-2 |
|
Relative difference in rotations \(\mathrm{DRX}\) |
|
0.62151906 |
1 10-6 |
|
FLEXION POS. - PHASE DECHAR. ELAS. \(t=\mathrm{3,5}\) |
||||
Relative moment difference \({M}_{\mathrm{yy}}\) |
|
0 |
7 10-2 |
|
Relative difference in rotations \(\mathrm{DRX}\) |
|
0.62151905 |
1 10-6 |
Comparative moment/rotation diagrams in cyclic bending for load \(\mathrm{f1}\) :
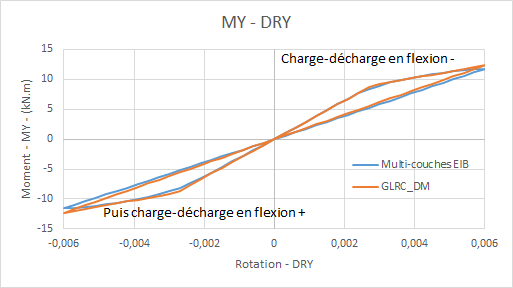
refill
(opposite bending)
Comparative graphs rotation \(\mathrm{DRX}\) (due to the Poisson effect) as a function of time for loading \(\mathrm{f1}\) :
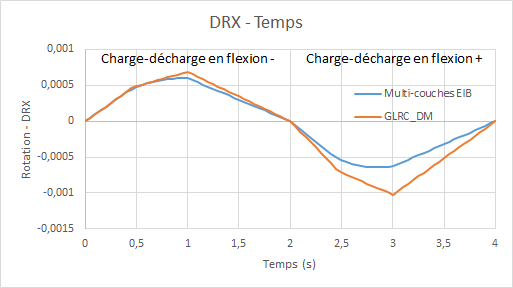
refill
(opposite bending)
landfill
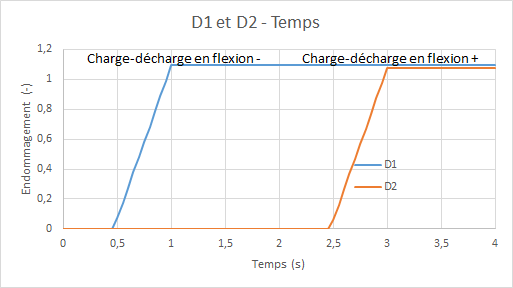
Diagrams of the evolution of the damage of model GLRC_DM (\({d}_{1}\) for the upper side and \({d}_{2}\) for the lower side) as a function of time:
4.5. Tested quantities and results for the f2 loading function#
The average moments along the axis \(\mathrm{Oy}\) and the average rotations along the axis \(\mathrm{Ox}\) en \(\mathrm{A2}-\mathrm{A4}\) obtained by multi-layer modeling (reference) and by that based on the model GLRC_DM are compared, in terms of relative differences; some tolerances are taken in absolute value, others in relative values, others in relative values (from a non-regression value, they are then noted « R »), on these relative differences:
Identification |
Reference type |
Reference value |
Tolerance |
|
FLEXION NEG. - PHASE CHAR. ELAS. \(t=\mathrm{0,25}\) |
||||
Relative moment difference \({M}_{\mathrm{yy}}\) |
|
0 |
5 10-2 |
|
Relative difference in rotations \(\mathrm{DRX}\) |
|
0 |
5 10-2 |
|
FLEXION NEG. - PHASE CHAR. ENDO. \(t=\mathrm{1,0}\) |
||||
Relative moment difference \({M}_{\mathrm{yy}}\) |
|
0 |
7 10-2 |
|
Relative difference in rotations \(\mathrm{DRX}\) |
|
0 |
1.5 10-1 |
|
FLEXION NEG. - PHASE DECHAR. ELAS. \(t=\mathrm{1,5}\) |
||||
Relative moment difference \({M}_{\mathrm{yy}}\) |
|
0 |
7 10-2 |
|
Relative difference in rotations \(\mathrm{DRX}\) |
|
0 |
1.5 10-1 |
|
FLEXION POS. - PHASE CHAR. ELAS. \(t=\mathrm{2,25}\) |
||||
Relative moment difference \({M}_{\mathrm{yy}}\) |
|
0 |
5 10-2 |
|
Relative difference in rotations \(\mathrm{DRX}\) |
|
0.2755444 |
1 10-6 |
|
FLEXION POS. - PHASE CHAR. ENDO. \(t=\mathrm{3,0}\) |
||||
Relative moment difference \({M}_{\mathrm{yy}}\) |
|
0 |
7 10-2 |
|
Relative difference in rotations \(\mathrm{DRX}\) |
|
0.6215190 |
1 10-6 |
|
FLEXION POS. - PHASE DECHAR. ELAS. \(t=\mathrm{3,5}\) |
||||
Relative moment difference \({M}_{\mathrm{yy}}\) |
|
0 |
7 10-2 |
|
Relative difference in rotations \(\mathrm{DRX}\) |
|
0.6215190 |
1 10-6 |
It is verified that these results are identical to those obtained with load \(\mathrm{f1}\) (in the opposite direction).
4.6. Tested quantities and results for the f3 loading function#
We compare the average moments along the \(\mathrm{Oy}\) axis and the average rotations along the \(\mathrm{Ox}\) en \(\mathrm{A2}-\mathrm{A4}\) axis obtained by multi-layer modeling (reference) and by that based on the model GLRC_DM, in terms of relative differences:
Identification |
Reference type |
Reference value |
Tolerance |
|
FLEXION NEG. - PHASE CHAR. ELAS. \(t=\mathrm{4,25}\) |
||||
Relative moment difference \({M}_{\mathrm{yy}}\) |
|
0 |
8 10-2 |
|
Relative difference in rotations \(\mathrm{DRX}\) |
|
0 |
5 10-2 |
|
FLEXION NEG. - PHASE CHAR. ENDO. \(t=\mathrm{5,0}\) |
||||
Relative moment difference \({M}_{\mathrm{yy}}\) |
|
0 |
8 10-2 |
|
Relative difference in rotations \(\mathrm{DRX}\) |
|
0 |
1.5 10-1 |
|
FLEXION NEG. - PHASE DECHAR. ELAS. \(t=\mathrm{1,5}\) |
||||
Relative moment difference \({M}_{\mathrm{yy}}\) |
|
0 |
8 10-2 |
|
Relative difference in rotations \(\mathrm{DRX}\) |
|
0 |
1.5 10-1 |
|
FLEXION POS. - PHASE CHAR. ELAS. \(t=\mathrm{2,25}\) |
||||
Relative moment difference \({M}_{\mathrm{yy}}\) |
|
0 |
8 10-2 |
|
Relative difference in rotations \(\mathrm{DRX}\) |
|
0.2755444 |
1 10-6 |
|
FLEXION POS. - PHASE CHAR. ENDO. \(t=\mathrm{3,0}\) |
||||
Relative moment difference \({M}_{\mathrm{yy}}\) |
|
0 |
8 10-2 |
|
Relative difference in rotations \(\mathrm{DRX}\) |
|
0.621519060 |
1 10-6 |
|
FLEXION POS. - PHASE DECHAR. ELAS. \(t=\mathrm{3,5}\) |
||||
Relative moment difference \({M}_{\mathit{yy}}\) |
|
0 |
8 10-2 |
|
Relative difference in rotations \(\mathit{DRX}\) |
|
0.621519050 |
1 10-6 |
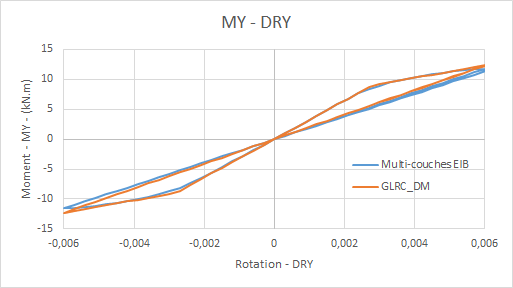
Comparative moment/rotation diagrams in cyclic bending for load \(\mathit{f3}\) :
Comparative graphs rotation \(\mathit{DRX}\) (due to the Poisson effect) as a function of time for loading \(\mathit{f3}\) :
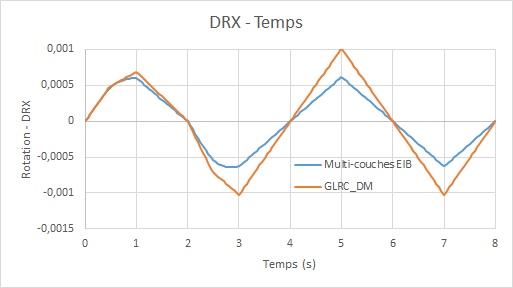
Diagrams of the evolution of the damage of model GLRC_DM (\({d}_{1}\) for the upper side and \({d}_{2}\) for the lower side) as a function of time:
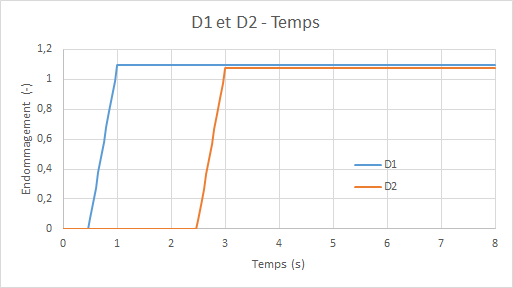
It is observed that the second cycle of alternating flexure does not cause further damage, as expected.
4.7. notes#
In consideration of the preceding curves, we find that with a precise adjustment of the parameters of model GLRC_DM, the results of the model GLRC_DMsont are very close to those of the reference calculation. This means that model GLRC_DMpeut well represents the behavior of reinforced concrete slabs under pure alternating bending. It should be noted that at the level of the following rotation \(X\) (due to the Poisson effect), after damage occurs, the difference between the two models appears clearly to the detriment of the response provided by the model GLRC_DM (based on the hypothesis of isotropic equivalent material, see [R7.01.32]).