12. J modeling#
12.1. Characteristics of modeling#
Traction Coupling - Compression and Flexion.
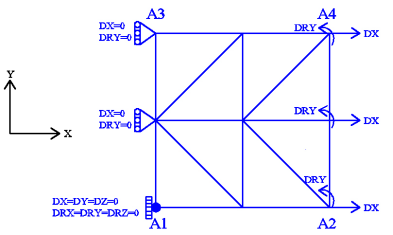
Figure 12.1-a: mesh and boundary conditions
Modeling: DKTG
Boundary conditions: Traction — Compression and Flexion coupling:
\(\mathrm{DX}=0.0\) and \(\mathrm{DRY}=0.0\) on the \({A}_{1}\mathrm{-}{A}_{3}\) edge
\(\mathrm{DX}={U}_{0}\times f(t)\) and \(\mathrm{DRY}={R}_{0}\times f(t)\) on the \({A}_{2}-{A}_{4}\) edge,
where \({U}_{0}=1.\times {10}^{-3}\), \({R}_{0}=3.\times {10}^{-2}\), and \(f(t)\) is the magnitude of cyclic loading as a function of the (pseudo-time) parameter \(t\).
The following load is considered:
The same \(f\) loading function for membrane and flexure:
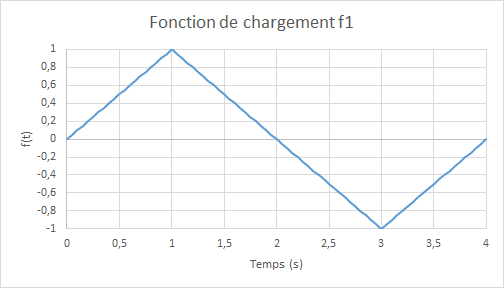
Figure 12.1-b: loading function
12.2. Characteristics of the mesh#
Number of knots: 9
Number of stitches: 8 TRIA3; 8 SEG2.
12.3. Modeling DHRC#
Refer to modeling DHRC explained for the H (§ 10) pure traction-compression and I (§ 11) pure flexure models.
12.4. Tested values and results#
The average reaction forces along the axis \(\mathit{Ox}\) and the average displacements along the axis \(\mathit{Oy}\) en \(\mathrm{A2}-\mathrm{A4}\) obtained by multi-layer modeling (reference) and by those based on the models GLRC_DMetDHRC are compared, in terms of relative differences; the tolerance is taken as an absolute value on these relative differences; the tolerance is taken as an absolute value on these relative differences:
Identification |
Reference type |
Reference value |
Tolerance |
FLEXION POSITIVE - ELASTIQUE \(t=\mathrm{0,25}\) |
|||
Relative difference \(\mathit{MY}\) EIB - GLRC_DM |
|
1.82558179048 |
1 10-6 |
Relative difference \(\mathit{DRX}\) EIB - GLRC_DM |
|
10.4852341828 |
1 10-6 |
FLEXION POSITIVE - ENDOMMAGEMENT \(t=\mathrm{1,0}\) |
|||
Relative difference \(\mathit{MY}\) EIB - GLRC_DM |
|
1.26753934606 |
1 10-6 |
FLEXION POSITIVE - DECHARGEMENT \(t=\mathrm{1,5}\) |
|||
Relative difference \(\mathit{MY}\) EIB - GLRC_DM |
|
1.26753926003 |
1 10-6 |
FLEXION NEGATIVE — ELASTIQUE \(t=\mathrm{2,25}\) |
|||
Relative difference \(\mathit{MY}\) EIB - GLRC_DM |
|
-0.425273286817 |
1 10-6 |
FLEXION NEGATIVE - ENDOMMAGEMENT \(t=\mathrm{3,0}\) |
|||
Relative difference \(\mathit{MY}\) EIB - GLRC_DM |
|
-0.399008689191 |
1 10-6 |
FLEXION NEGATIVE - **** DECHARGEMENT ** \(t=\mathrm{3,5}\) |
|||
Relative difference \(\mathit{MY}\) EIB - GLRC_DM |
|
-0.399008688401 |
1 10-6 |
Identification |
Reference type |
Reference value |
Tolerance |
FLEXION POSITIVE - ELASTIQUE \(t=\mathrm{0,05}\) |
|||
Relative difference \(\mathit{MY}\) DHRC - GLRC_DM |
|
0.053928832983 |
1 10-6 |
Relative difference \(\mathit{DRX}\) DHRC - GLRC_DM |
|
-0.1370655366 |
1 10-6 |
FLEXION POSITIVE - ENDOMMAGEMENT \(t=\mathrm{0,25}\) |
|||
Relative difference \(\mathit{MY}\) DHRC - GLRC_DM |
|
0.214689998328 |
1 10-6 |
Relative difference \(\mathit{DRX}\) DHRC - GLRC_DM |
|
-0.057928666514 |
1 10-6 |
FLEXION POSITIVE - GLISSEMENT \(t=\mathrm{0,8}\) |
|||
Relative difference \(\mathit{MY}\) DHRC - GLRC_DM |
|
0.0792484783618 |
1 10-6 |
Relative difference \(\mathit{DRX}\) DHRC - GLRC_DM |
|
0.132806100434 |
1 10-6 |
FLEXION POSITIVE - DECHARGEMENT \(t=\mathrm{1,5}\) |
|||
Relative difference \(\mathit{MY}\) DHRC - GLRC_DM |
|
0.112788628941 |
1 10-6 |
Relative difference \(\mathit{DRX}\) DHRC - GLRC_DM |
|
0.20405539779 |
1 10-6 |
FLEXION BORN GATIVE - CHARGEMENT \(t=\mathrm{2,05}\) |
|||
Relative difference \(\mathit{MY}\) DHRC - GLRC_DM |
|
-0.270360378252 |
1 10-6 |
Relative difference \(\mathit{DRX}\) DHRC - GLRC_DM |
|
-0.509781601641 |
1 10-6 |
FLEXION BORN GATIVE - **** GLISSEMENT ** \(t=\mathrm{3,0}\) |
|||
Relative difference \(\mathit{MY}\) DHRC - GLRC_DM |
|
0.119074706017 |
1 10-6 |
Relative difference \(\mathit{DRX}\) DHRC - GLRC_DM |
|
-0.242672756295 |
1 10-6 |
FLEXION BORN GATIVE - **** GLISSEMENT ** \(t=\mathrm{3,5}\) |
|||
Relative difference \(\mathit{MY}\) DHRC - GLRC_DM |
|
0.146471323813 |
1 10-6 |
Relative difference \(\mathit{DRX}\) DHRC - GLRC_DM |
|
-0.22446671411 |
1 10-6 |
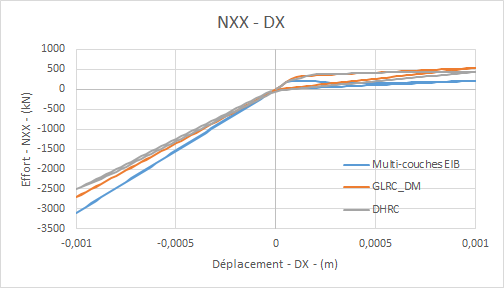
Force comparative graphs \(\mathrm{FX}\) — displacement \(\mathrm{DX}\) for load \(f\) :
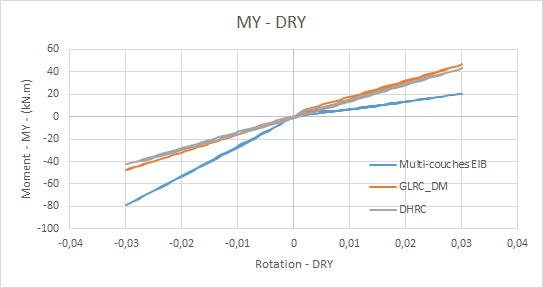
Comparative moment graphs \(\mathrm{MY}\) **— rotation:math:`mathrm{DRY}`**for loading**:math:`f`**: **
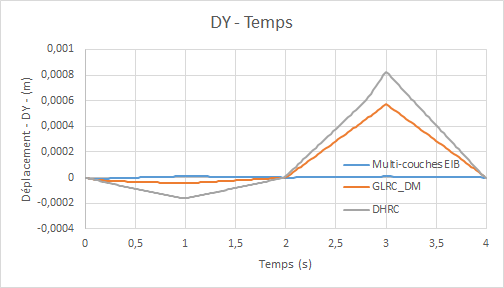
Comparative graphs displacement \(\mathrm{DY}\) (due to the Poisson effect) as a function of time:
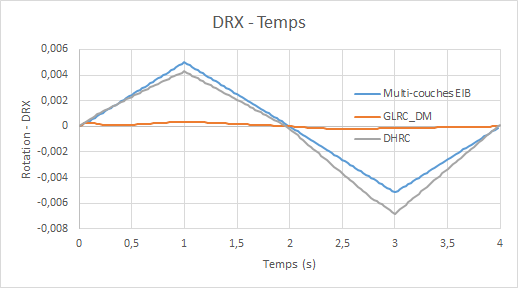
Comparative rotation graphs \(\mathrm{DRX}\) (due to the Poisson effect) as a function of time:
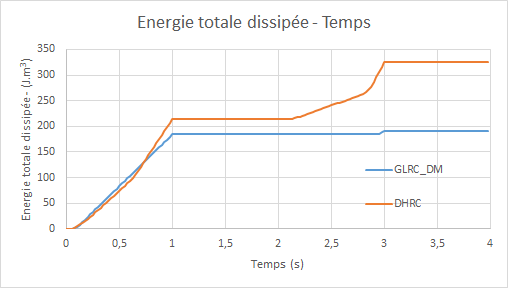
Diagrams of the evolution of the total energy dissipated by the models GLRC_DM and DHRC as a function of time:
12.5. notes#
The test case carried out here aims to test models GLRC_DM and DHRC under loads that are significant enough for the stiffness of the steels to effectively regain the stiffness of the steels on the reference EIB and the relative steel-concrete slip on the model DHRC. This test case uses test case SSNS106C by adding the reference DHRC in order to compare the global model GLRC_DM with a model taking into account more energy dissipation via the representation of sliding mechanisms internal to the steel-concrete interface. The remarks made previously during the study of pure flexure and traction-compression are repeated.