5. C modeling#
5.1. Characteristics of modeling#
Tensile coupling - compression and flexure.
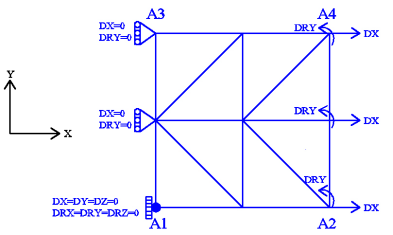
Figure 5.1-a: Meshing and boundary conditions
Modeling: DKTG
Boundary conditions: Traction — Compression and Flexion coupling:
\(\mathrm{DX}=0.0\) and \(\mathrm{DRY}=0.0\) on the \({A}_{1}-{A}_{3}\) edge
\(\mathrm{DX}={U}_{0}\times f(t)\) and \(\mathrm{DRY}={R}_{0}\times f(t)\) on the \({A}_{2}-{A}_{4}\) edge,
where \({U}_{0}=1.5\times {10}^{-4}\), \({R}_{0}=5.\times {10}^{-3}\), and \(f(t)\) is the magnitude of cyclic loading as a function of the (pseudo-time) parameter \(t\). Two types of loading are considered:
The same loading function \(\mathrm{f1}\) for membrane and flexure (synchronous case):
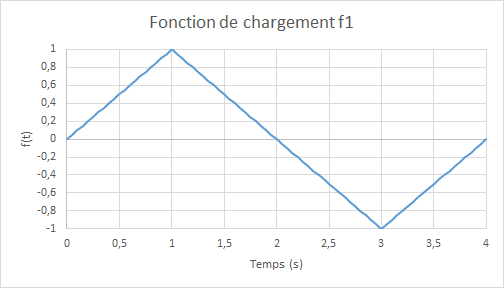
Figure 5.1-b: loading function f1
The \(\mathrm{f2}\) function of membrane loading twice as fast as that of flexure (in practice, the membrane frequencies of a slab are higher than those of flexure):

Figure 5.1-c: f2 loading function
5.2. Characteristics of the mesh#
Number of knots: 9 Number of stitches: 8 TRIA3; 8 SEG2.
5.3. Quantities tested and results: first loading (same loading function for membrane and flexure)#
The average forces along the axis \(\mathrm{Ox}\), the average displacements along the axis \(\mathrm{Oy}\), the average moments along the axis \(\mathrm{Oy}\) and the average rotations along the axis \(\mathrm{Ox}\) en \(\mathrm{A2}-\mathrm{A4}\) obtained by the multi-layer modeling s (reference) and by that based on the model GLRC_DM and by that based on the model, are compared, in terms of relative differences; the tolerances are taken as a relative value on these relative differences (non-regression):
Identification |
Reference type |
Reference value |
Tolerance |
|
PHASE ELASTIQUE \(t=\mathrm{0,25}\) |
||||
Relative difference in efforts \({N}_{\mathrm{xx}}\) |
|
0.0308768 |
1 10-6 |
|
Relative difference in displacement \(\mathrm{DY}\) |
|
6,800 10-3 |
1 10-6 |
|
Relative moment difference \({M}_{\mathrm{yy}}\) |
|
0.0506625 |
1 10-6 |
|
Relative difference in rotations \(\mathrm{DRX}\) |
|
0.0456055 |
1 10-6 |
|
PHASE ENDOMMAGEMENT \(t=\mathrm{1,0}\) |
||||
Relative difference in efforts \({N}_{\mathrm{xx}}\) |
|
0.6199769 |
1 10-6 |
|
Relative difference in displacement \(\mathrm{DY}\) |
|
1.0302274 |
1 10-6 |
|
Relative moment difference \({M}_{\mathrm{yy}}\) |
|
1.1531708 |
1 10-6 |
|
Relative difference in rotations \(\mathrm{DRX}\) |
|
4.3790440 |
1 10-6 |
|
Internal variable*V8* |
NON_REGRESSION |
|||
Internal variable*V9* |
NON_REGRESSION |
|||
Internal variable*V10* |
NON_REGRESSION |
|||
Internal variable*V11* |
NON_REGRESSION |
|||
Internal variable*V12* |
NON_REGRESSION |
|||
Internal variable*V13* |
NON_REGRESSION |
|||
Internal variable*V14* |
NON_REGRESSION |
|||
Internal variable*V15* |
NON_REGRESSION |
|||
Internal variable*V16* |
NON_REGRESSION |
|||
Internal variable*V17* |
NON_REGRESSION |
|||
Internal variable*V18* |
NON_REGRESSION |
|||
PHASE DECHARGEMENT \(t=\mathrm{1,5}\) |
||||
Relative difference in efforts \({N}_{\mathrm{xx}}\) |
|
0.6199769 |
1 10-6 |
|
Relative difference in displacement \(\mathrm{DY}\) |
|
1.0302272 |
1 10-6 |
|
Relative moment difference \({M}_{\mathrm{yy}}\) |
|
1.1531708 |
1 10-6 |
|
Relative difference in rotations \(\mathrm{DRX}\) |
|
4.3790437 |
1 10-6 |
|
PHASE ELASTIQUE \(t=\mathrm{2,25}\) |
||||
Relative moment difference \({M}_{\mathrm{yy}}\) |
|
-0.279039 |
1 10-6 |
|
Relative difference in rotations \(\mathrm{DRX}\) |
|
-0.045021 |
1 10-6 |
|
PHASE RECHARGEMENT \(t=\mathrm{3,0}\) |
||||
Relative difference in efforts \({N}_{\mathrm{xx}}\) |
|
0.0725839 |
1 10-6 |
|
Relative difference in displacement \(\mathrm{DY}\) |
|
0.5134477 |
1 10-6 |
|
Relative moment difference \({M}_{\mathrm{yy}}\) |
|
-0.305571 |
1 10-6 |
|
Relative difference in rotations \(\mathrm{DRX}\) |
|
-0.074300 |
1 10-6 |
|
PHASE DECHARGEMENT \(t=\mathrm{3,5}\) |
||||
Relative difference in efforts \({N}_{\mathrm{xx}}\) |
|
0.0725839 |
1 10-6 |
|
Relative difference in displacement \(\mathrm{DY}\) |
|
0.5134477 |
1 10-6 |
|
Relative moment difference \({M}_{\mathrm{yy}}\) |
|
-0.305571 |
1 10-6 |
|
Relative difference in rotations \(\mathrm{DRX}\) |
|
-0.074300 |
1 10-6 |
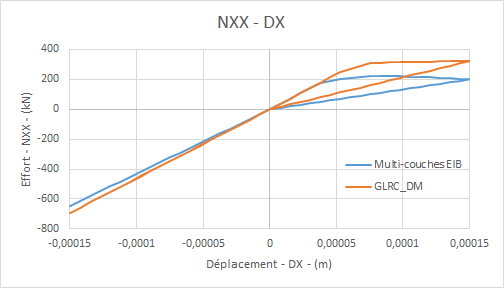
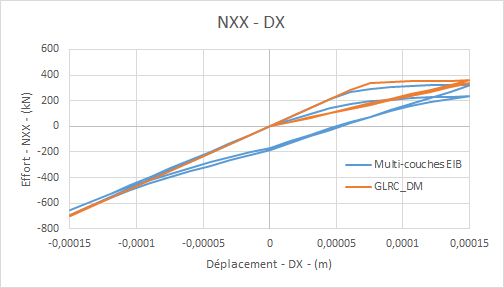
Diagrams compared efforts \({N}_{\mathrm{xx}}\) — based on displacement \(\mathrm{DX}\) imposed for load \(\mathrm{f1}\) :: **
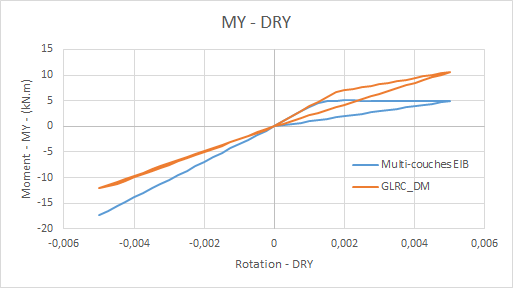
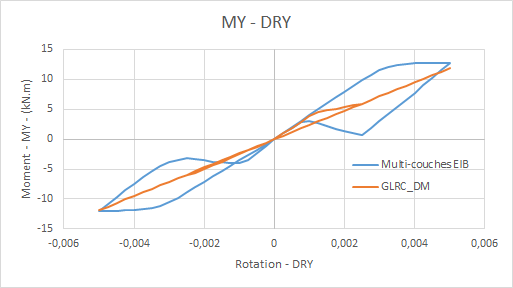
Comparative graphs moment \({M}_{\mathrm{yy}}\) based on the rotation \(\mathrm{DRY}\) imposed for loading \(\mathrm{f1}\) :: **
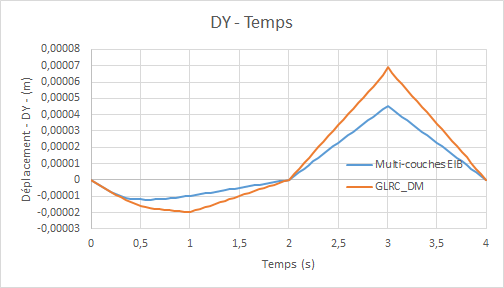
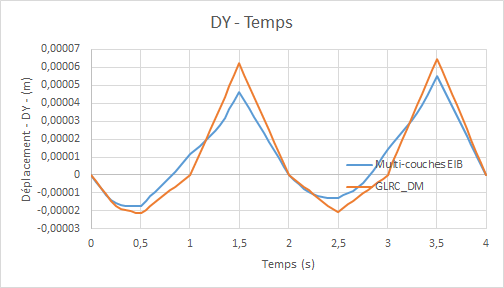
Comparative displacement graphs \(\mathrm{DY}\) (due to the Poisson effect) for loading \(\mathrm{f1}\) :
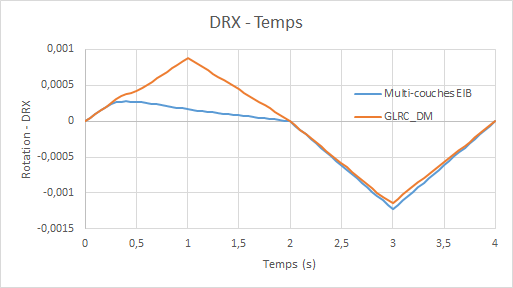
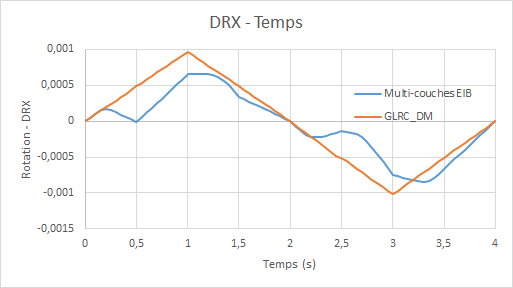
Comparative rotation graphs \(\mathrm{DRX}\) (due to the Poisson effect) for loading \(\mathrm{f1}\) :
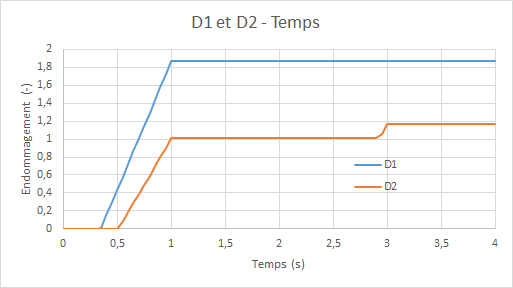
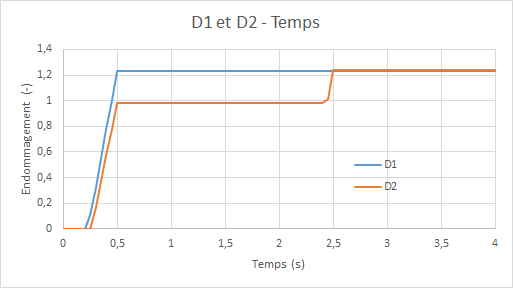
Diagrams of the evolution of model damage GLRC_DM ( \({d}_{1}\) for the upper side and \({d}_{2}\) for the lower side) as a function of time:
5.4. Quantities tested and results: second loading (membrane twice as fast as flexure)#
The average forces along the axis \(\mathit{Ox}\), the average displacements along the axis \(\mathit{Oy}\), the average moments along the axis \(\mathit{Oy}\) and the average rotations along the axis \(\mathit{Ox}\) en \(\mathrm{A2}-\mathrm{A4}\) obtained by multi-layer modeling (reference) and by that based on the model GLRC_DM are compared, in terms of relative differences; the tolerances are taken as a relative value on these relative differences (non-regression):
Identification |
Reference type |
Reference value |
Tolerance |
|
PHASE ELASTIQUE \(t=\mathrm{0,2}\) |
||||
Relative difference in efforts \({N}_{\mathrm{xx}}\) |
|
0.076636834 |
1 10-6 |
|
Relative difference in displacement \(\mathrm{DY}\) |
|
0.04157561 |
1 10-6 |
|
PHASE ELASTIQUE \(t=\mathrm{0,25}\) |
||||
Relative moment difference \({M}_{\mathrm{yy}}\) |
|
0.704009303 |
1 10-6 |
|
Relative difference in rotations \(\mathrm{DRX}\) |
|
0.598054490 |
1 10-6 |
|
PHASE ENDOMMAGEMENT \(t=\mathrm{0,5}\) |
||||
Relative difference in efforts \({N}_{\mathrm{xx}}\) |
|
0.123330386 |
1 10-6 |
|
Relative difference in displacement \(\mathrm{DY}\) |
|
0.255062957 |
1 10-6 |
|
PHASE ENDOMMAGEMENT \(t=\mathrm{1,0}\) |
||||
Relative moment difference \({M}_{\mathrm{yy}}\) |
|
-0.07043058 |
1 10-6 |
|
Relative difference in rotations \(\mathrm{DRX}\) |
|
0.469177765 |
1 10-6 |
|
PHASE DECHARGEMENT \(t=\mathrm{1,5}\) |
||||
Relative difference in efforts \({N}_{\mathrm{xx}}\) |
|
0.011450607 |
1 10-6 |
|
Relative difference in displacement \(\mathrm{DY}\) |
|
0.341544237 |
1 10-6 |
|
Relative moment difference \({M}_{\mathrm{yy}}\) |
|
-0.40261933 |
1 10-6 |
|
Relative difference in rotations \(\mathrm{DRX}\) |
|
0.418428062 |
1 10-6 |
|
PHASE ELASTIQUE \(t=\mathrm{2,25}\) |
||||
Relative moment difference \({M}_{\mathrm{yy}}\) |
|
-0.20854202 |
1 10-6 |
|
Relative difference in rotations \(\mathrm{DRX}\) |
|
0.194832056 |
1 10-6 |
|
PHASE ELASTIQUE \(t=\mathrm{2,5}\) |
||||
Relative difference in efforts \({N}_{\mathit{xx}}\) |
|
0.444039545 |
1 10-6 |
|
Relative difference in displacement \(\mathit{DY}\) |
|
0.621203835 |
1 10-6 |
|
PHASE RECHARGEMENT \(t=\mathrm{3,0}\) |
||||
Relative moment difference \({M}_{\mathit{yy}}\) |
|
-0.01497317 |
1 10-6 |
|
Relative difference in rotations \(\mathit{DRX}\) |
|
0.363498924 |
1 10-6 |
|
PHASE DECHARGEMENT \(t=\mathrm{3,5}\) |
||||
Relative difference in efforts \({N}_{\mathit{xx}}\) |
|
0.058363999 |
1 10-6 |
|
Relative difference in displacement \(\mathit{DY}\) |
|
0.178663987 |
1 10-6 |
|
Relative moment difference \({M}_{\mathit{yy}}\) |
|
-0.33210745 |
1 10-6 |
|
Relative difference in rotations \(\mathit{DRX}\) |
|
-0.23297047 |
1 10-6 |
Comparative force graphs \(\mathrm{FX}\) ( efforts \({N}_{\mathrm{xx}}\)) — ( efforts) — as a function of displacement \(\mathrm{DX}\) imposed for load \(\mathrm{f2}\) :
Comparative graphs moment \({M}_{\mathrm{yy}}\) depending on the rotation \(\mathrm{DRY}\) imposed for loading \(\mathrm{f2}\) :: **
Comparative displacement graphs \(\mathrm{DY}\) (due to the Poisson effect) for loading \(\mathrm{f2}\) :
Comparative rotation graphs \(\mathrm{DRX}\) (due to the Poisson effect) for loading \(\mathrm{f2}\) :
Diagrams of the evolution of model damage **** GLRC_DM **** ( \({d}_{1}\) for the upper side and \({d}_{2}\) for the lower side) as a function of time:
Remarks
These results are obtained using the material parameters that were identified from the A tests (for membrane parameters) and B tests (for flexure parameters). Although the results of the GLRC_DMen tensile — pure compression and pure flexure model are very satisfactory compared to the multilayer reference calculation, the error of the GLRC_DMen membrane coupling — flexure model in the non-linear phase is significant. It is observed that the response in the elastic phase is correct and that the difference is due to the criterion for the onset of damage. With reference to the curves, it can be seen that in membrane-flexure coupling, the damage thresholds (\({N}_{D}\) and \({M}_{D}\)) already identified from pure tension-compression tests and pure flexure, give an overestimation in the case of flexion-membrane coupling compared to the reference solution. This leads to a significant error in the following phases.
It is proposed to lower the values of \({N}_{D}\) and \({M}_{D}\) by 10% in order to reduce this error. (cf. [R7.01.32] model GLRC_DM, §3.2.1).
5.5. Tested quantities and results: elastic loading#
In this modeling, it is verified that the results obtained for elastic loading are identical for:
a MECA_STATIQUE calculation with a ELAS_GLRC law
a STAT_NON_LINE calculation with a ELAS_GLRC law
a STAT_NON_LINE calculation with a GLRC_DM law
We compare the membrane forces along x and the moments of bending along x at the moment \(t=1s\) for the point located at \(x=\mathrm{0,83333}m\) and at \(y=\mathrm{0,9166667}m\).
Identification |
Reference type |
Reference value |
Tolerance |
|
\({N}_{\mathit{xx}}\) for calculation 1 |
NON_REGRESSION |
7.14 105 |
1 10-6 |
|
\({N}_{\mathit{xx}}\) for calculation 2 |
NON_REGRESSION |
7.14 105 |
1 10-6 |
|
\({N}_{\mathit{xx}}\) for calculation 3 |
NON_REGRESSION |
7.14 105 |
1 10-6 |
|
\({M}_{\mathit{xx}}\) for calculation 1 |
NON_REGRESSION |
1.93 104 |
1 10-6 |
|
\({M}_{\mathit{xx}}\) for calculation 2 |
NON_REGRESSION |
1.93 104 |
1 10-6 |
|
\({M}_{\mathit{xx}}\) for calculation 3 |
NON_REGRESSION |
1.93 104 |
1 10-6 |
We do the same to test ELAS_DHRC. We check that the three calculations give the same results:
a MECA_STATIQUE calculation with a ELAS_DHRC law
a STAT_NON_LINE calculation with a ELAS_DHRC law
a calculation STAT_NON_LINEavec a law DHRC
We compare the membrane forces following \(x\) and the bending moments following \(x\) at the time \(t=1s\) for the point located in \(x=\mathrm{0,83333}m\) and in \(y=\mathrm{0,9166667}m\).
Identification |
Reference type |
Reference value |
Tolerance |
|
\({N}_{\mathit{xx}}\) for calculation 1 |
NON_REGRESSION |
7.10 105 |
1 10-6 |
|
\({N}_{\mathit{xx}}\) for calculation 2 |
NON_REGRESSION |
7.10 105 |
1 10-6 |
|
\({N}_{\mathit{xx}}\) for calculation 3 |
NON_REGRESSION |
7.10 105 |
1 10-6 |
|
\({M}_{\mathit{xx}}\) for calculation 1 |
NON_REGRESSION |
1.82 104 |
1 10-6 |
|
\({M}_{\mathit{xx}}\) for calculation 2 |
NON_REGRESSION |
1.82 104 |
1 10-6 |
|
\({M}_{\mathit{xx}}\) for calculation 3 |
NON_REGRESSION |
1.82 104 |
1 10-6 |