12. G modeling results#
12.1. Tested values of the G modeling#
The displacements of the nodes N02 and N03 and the internal variables V1 and V2 of the discrete element N02-N03 are tested in non-regression at each maximum of the force value. At the same moments with an analytical reference with respect to the criterion (material data), the force in this same discrete element is tested.
Time (s) |
Identification |
Reference type |
Reference |
Tolerance |
2,715E-1 |
Displacement N02 |
NON_REGRESSION |
||
Displacement N03 |
NON_REGRESSION |
|||
Effort |
ANALYTIQUE |
-449.58262915649607 |
1E-3 |
|
V1 |
NON_REGRESSION |
|||
V2 |
NON_REGRESSION |
|||
1,895E-1 |
Displacement N02 |
NON_REGRESSION |
||
Displacement N03 |
NON_REGRESSION |
|||
Effort |
ANALYTIQUE |
-400.1156325363858 |
1E-3 |
|
V1 |
NON_REGRESSION |
|||
V2 |
NON_REGRESSION |
|||
2,985E-1 |
Displacement N02 |
NON_REGRESSION |
||
Displacement N03 |
NON_REGRESSION |
|||
Effort |
ANALYTIQUE |
-375.85067189738197 |
1E-3 |
|
V1 |
NON_REGRESSION |
|||
V2 |
NON_REGRESSION |
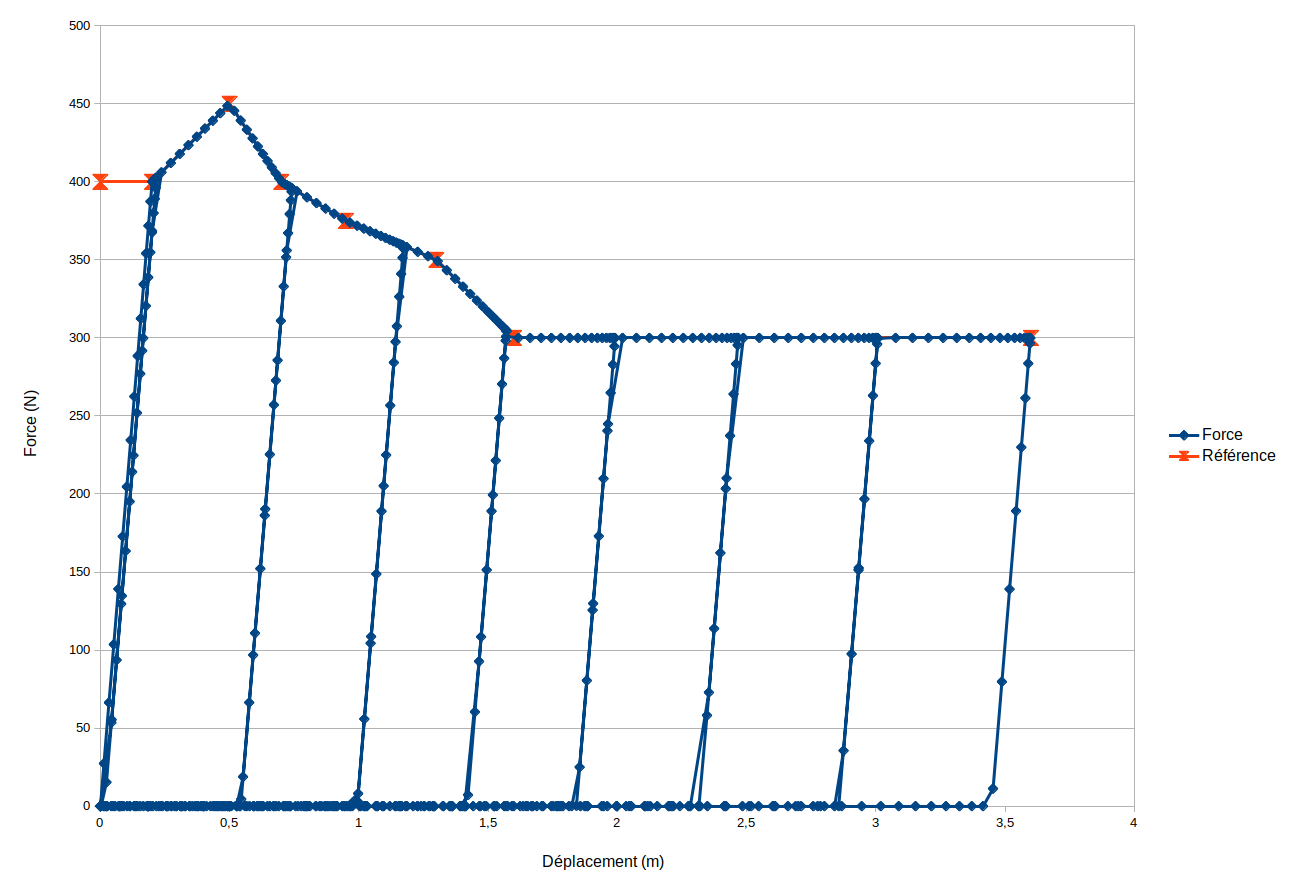
The figure below shows the force/displacement curve of the discrete element. It can be seen that the criterion is well followed with the load and discharge curves with an increase in the amplitude of the loading.