5. C modeling#
5.1. Characteristics of modeling#
Loading is a combination of traction — compression and flexure.

Figure 5.1-a : m**mesh and boundary conditions**
Modeling: DKT
Boundary conditions: Traction — Compression and Flexion coupling:
\(\mathrm{DX}=0.0\) and \(\mathrm{DRY}=0.0\) on the \({A}_{1}-{A}_{3}\) edge
\(\mathrm{DX}={U}_{0}\times f(t)\) and \(\mathrm{DRY}={R}_{0}\times f(t)\) on the \({A}_{2}-{A}_{4}\) edge,
where \({U}_{0}\mathrm{=}1.5\times {10}^{\mathrm{-}4}m\), \({R}_{0}\mathrm{=}5.\times {10}^{\mathrm{-}3}\mathit{rad}\), and \(f(t)\) is the magnitude of the cyclic loading as a function of the (pseudo-time) parameter \(t\). Two types of loading are considered:
The same loading function \(\mathrm{f1}\) for membrane and flexure (synchronous case):
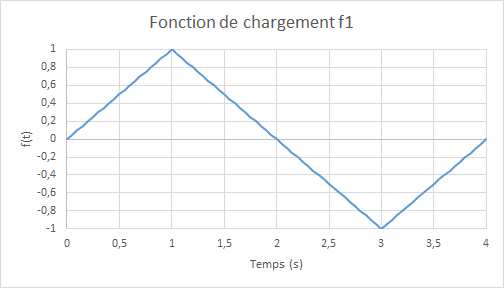
Figure 5.1-b : f1 loading function
The \(\mathrm{f2}\) function of membrane loading twice as fast as that of flexure (in practice, the membrane frequencies of a slab are higher than those of flexure):

Figure 5.1-c : f2 loading function
5.2. Characteristics of the mesh#
Number of knots: 9 Number of stitches: 8 TRIA3; 8 SEG2.
5.3. Quantities tested and results: first loading (same loading function for membrane and flexure)#
We compare the sum of the forces along the axis \(\mathit{Ox}\) in \(\mathit{A1}\mathrm{-}\mathit{A3}\), the displacements along the axis \(\mathit{Oy}\) in \(\mathit{A4}\), the moments along the axis \(\mathit{Oy}\) in \(\mathit{A1}\mathrm{-}\mathit{A3}\) and the rotations along the axis \(\mathit{Ox}\) en \(\mathit{A4}\) obtained by the multilayer modeling with the ENDO_ISOT_BETON law and by the one based on the law BETON_REGLE_PR, in terms of relative differences; the tolerances are taken in absolute values:
Identification |
Reference type |
Reference value |
Tolerance |
|
PHASE ELASTIQUE \(t=\mathrm{0,25}\) |
||||
Relative difference in efforts \({N}_{\mathrm{xx}}\) |
|
1 10-6 |
||
Relative difference in displacement \(\mathrm{DY}\) |
|
1 10-6 |
||
Relative moment difference \({M}_{\mathrm{yy}}\) |
|
1 10-6 |
||
Relative difference in rotations \(\mathrm{DRX}\) |
|
1 10-6 |
||
PHASE ENDOMMAGEMENT \(t=\mathrm{1,0}\) |
||||
Relative difference in efforts \({N}_{\mathrm{xx}}\) |
|
1 10-6 |
||
Relative difference in displacement \(\mathrm{DY}\) |
|
1 10-6 |
||
Relative moment difference \({M}_{\mathrm{yy}}\) |
|
1 10-6 |
||
Relative difference in rotations \(\mathrm{DRX}\) |
|
1 10-6 |
||
PHASE DECHARGEMENT \(t=\mathrm{1,5}\) |
||||
Relative difference in efforts \({N}_{\mathrm{xx}}\) |
|
1 10-6 |
||
Relative difference in displacement \(\mathrm{DY}\) |
|
1 10-6 |
||
Relative moment difference \({M}_{\mathrm{yy}}\) |
|
1 10-6 |
||
Relative difference in rotations \(\mathrm{DRX}\) |
|
1 10-6 |
||
PHASE ELASTIQUE \(t=\mathrm{2,25}\) |
||||
Relative moment difference \({M}_{\mathrm{yy}}\) |
|
1 10-6 |
||
Relative difference in rotations \(\mathrm{DRX}\) |
|
1 10-6 |
||
PHASE RECHARGEMENT \(t=\mathrm{3,0}\) |
||||
Relative difference in efforts \({N}_{\mathrm{xx}}\) |
|
1 10-6 |
||
Relative difference in displacement \(\mathrm{DY}\) |
|
1 10-6 |
||
Relative moment difference \({M}_{\mathrm{yy}}\) |
|
1 10-6 |
||
Relative difference in rotations \(\mathrm{DRX}\) |
|
1 10-6 |
||
PHASE DECHARGEMENT \(t=\mathrm{3,5}\) |
||||
Relative difference in efforts \({N}_{\mathrm{xx}}\) |
|
1 10-6 |
||
Relative difference in displacement \(\mathrm{DY}\) |
|
1 10-6 |
||
Relative moment difference \({M}_{\mathrm{yy}}\) |
|
1 10-6 |
||
Relative difference in rotations \(\mathrm{DRX}\) |
|
1 10-6 |
Diagrams compared efforts \({N}_{\mathrm{xx}}\) — based on displacement \(\mathrm{DX}\) imposed for load \(\mathrm{f1}\) :: **

Comparative graphs moment \({M}_{\mathrm{yy}}\) based on the rotation \(\mathrm{DRY}\) imposed for loading \(\mathrm{f1}\) :: **

Comparative displacement graphs \(\mathrm{DY}\) (due to the Poisson effect) for loading \(\mathrm{f1}\) :

Comparative rotation graphs \(\mathrm{DRX}\) (due to the Poisson effect) for loading \(\mathrm{f1}\) :

5.4. Quantities tested and results: second loading (membrane twice as fast as flexure)#
We compare the forces along the axis \(\mathrm{Ox}\) in \(\mathit{A1}\mathrm{-}\mathit{A3}\), the displacements along the axis \(\mathrm{Oy}\) in \(\mathit{A4}\), the moments along the axis \(\mathrm{Oy}\) in \(\mathit{A1}\mathrm{-}\mathit{A3}\) and the rotations along the axis \(\mathrm{Ox}\) en \(\mathit{A4}\) obtained by the multilayer modeling with the ENDO_ISOT_BETON law and by the one based on the law BETON_REGLE_PR, in terms of relative differences; the tolerances are taken in absolute values:
Identification |
Reference type |
Reference value |
Tolerance |
|
PHASE ELASTIQUE \(t=\mathrm{0,2}\) |
||||
Relative difference in efforts \({N}_{\mathrm{xx}}\) |
|
1 10-6 |
||
Relative difference in displacement \(\mathrm{DY}\) |
|
1 10-6 |
||
PHASE ELASTIQUE \(t=\mathrm{0,25}\) |
||||
Relative moment difference \({M}_{\mathrm{yy}}\) |
|
1 10-6 |
||
Relative difference in rotations \(\mathrm{DRX}\) |
|
1 10-6 |
||
PHASE ENDOMMAGEMENT \(t=\mathrm{0,5}\) |
||||
Relative difference in efforts \({N}_{\mathrm{xx}}\) |
|
1 10-6 |
||
Relative difference in displacement \(\mathrm{DY}\) |
|
1 10-6 |
||
PHASE ENDOMMAGEMENT \(t=\mathrm{1,0}\) |
||||
Relative moment difference \({M}_{\mathrm{yy}}\) |
|
1 10-6 |
||
Relative difference in rotations \(\mathrm{DRX}\) |
|
1 10-6 |
||
PHASE DECHARGEMENT \(t=\mathrm{1,5}\) |
||||
Relative difference in efforts \({N}_{\mathrm{xx}}\) |
|
1 10-6 |
||
Relative difference in displacement \(\mathrm{DY}\) |
|
1 10-6 |
||
Relative moment difference \({M}_{\mathrm{yy}}\) |
|
1 10-6 |
||
Relative difference in rotations \(\mathrm{DRX}\) |
|
1 10-6 |
||
PHASE ELASTIQUE \(t=\mathrm{2,25}\) |
||||
Relative moment difference \({M}_{\mathrm{yy}}\) |
|
1 10-6 |
||
Relative difference in rotations \(\mathrm{DRX}\) |
|
1 10-6 |
||
PHASE ELASTIQUE \(t=\mathrm{2,5}\) |
||||
Relative difference in efforts \({N}_{\mathit{xx}}\) |
|
1 10-6 |
||
Relative difference in displacement \(\mathit{DY}\) |
|
1 10-6 |
||
PHASE RECHARGEMENT \(t=\mathrm{3,0}\) |
||||
Relative moment difference \({M}_{\mathit{yy}}\) |
|
1 10-6 |
||
Relative difference in rotations \(\mathit{DRX}\) |
|
1 10-6 |
||
PHASE DECHARGEMENT \(t=\mathrm{3,5}\) |
||||
Relative difference in efforts \({N}_{\mathit{xx}}\) |
|
1 10-6 |
||
Relative difference in displacement \(\mathit{DY}\) |
|
1 10-6 |
||
Relative moment difference \({M}_{\mathit{yy}}\) |
|
1 10-6 |
||
Relative difference in rotations \(\mathit{DRX}\) |
|
1 10-6 |
Comparative force graphs \(\mathrm{FX}\) ( efforts \({N}_{\mathrm{xx}}\)) — ( efforts) — as a function of displacement \(\mathrm{DX}\) imposed for load \(\mathrm{f2}\) :

Comparative graphs moment \({M}_{\mathrm{yy}}\) depending on the rotation \(\mathrm{DRY}\) imposed for loading \(\mathrm{f2}\) :: **

Comparative displacement graphs \(\mathrm{DY}\) (due to the Poisson effect) for loading \(\mathrm{f2}\) :

Comparative rotation graphs \(\mathrm{DRX}\) (due to the Poisson effect) for loading \(\mathrm{f2}\) :

5.5. notes#
According to the preceding curves, it can be seen that the multilayer model with law BETON_REGLE_PR represents the overall behavior of reinforced concrete under bending and traction in a satisfactory manner under load. The same damage thresholds are identified. However, in discharge, law BETON_REGLE_PR follows the same curve as the charge, unlike law ENDO_ISOT_BETON.
The Poisson effect is not modelled by law BETON_REGLE_PR, so we obtain zero rotation in the DRX direction and zero DY displacement.
For the second load, a similar behavior is observed for the membrane-flexure coupling between BETON_REGLE_PRet ENDO_ISOT_BETON under load (elastic response, damage and compression). The same damage thresholds are identified.