4. B modeling#
4.1. Characteristics of modeling#
The loading is of the pure alternating bending type.

Figure 4.1-a : mesh and boundary conditions
Modeling: DKT
Boundary conditions:
\(\mathrm{DRY}=0.0\) on the \({A}_{1}-{A}_{3}\) ridge
\(\mathrm{DRY}={R}_{0}\times f(t)\) on the \({A}_{2}-{A}_{4}\) edge,
where \({R}_{0}=6\times {10}^{-3}\) and \(f(t)\) is the amplitude of the cyclic loading as a function of the (pseudo-time) parameter \(t\), to properly verify the model, we consider three loading functions as:
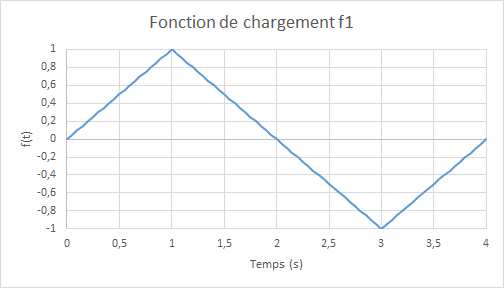
Figure 4.1-b : f negative flexion, then positive flexing |

Figure 4.1-c : f positive flexion, then negative flexing |

Figure 4.1-d : d two cycles of alternating flexure
Note: the extreme deformation of steels is: \(2.4\times {10}^{-3}\), i.e. below the transition to plasticity of the steels. Integration increment: \(0.05s\) .
4.2. Characteristics of the mesh#
Number of knots: 9. Number of stitches: 8 TRIA3.
4.3. Tested quantities and results for the f1 loading function#
We compare the sum of the moments along the axis \(\mathrm{Oy}\) in \(\mathit{A1}\mathrm{-}\mathit{A3}\) and the rotations along the axis \(\mathrm{Ox}\) in \(\mathit{A4}\) obtained by the multilayer modeling with the ENDO_ISOT_BETON law and by the one based on the BETON_REGLE_PR law, in terms of relative differences; the tolerance is taken as an absolute value on these relative differences; the tolerance is taken as an absolute value on these relative differences.
Identification |
Reference type |
Reference value |
Tolerance |
|
FLEXION NEG - PHASE CHAR. ELAS . \(t=\mathrm{0,25}\) |
||||
Relative moment difference \({M}_{\mathrm{yy}}\) |
|
0 |
3 10-2 |
|
Relative difference in rotations \(\mathrm{DRX}\) |
|
1 10-6 |
||
FLEXION NEG - PHASE CHAR. ENDO . \(t=\mathrm{1,0}\) |
||||
Relative moment difference \({M}_{\mathrm{yy}}\) |
|
0 |
1 10-2 |
|
Relative difference in rotations \(\mathrm{DRX}\) |
|
1 10-6 |
||
FLEXION NEG - PHASE DECHAR. ELAS . \(t=\mathrm{1,5}\) |
||||
Relative moment difference \({M}_{\mathrm{yy}}\) |
|
0 |
6 10-1 |
|
Relative difference in rotations DRX |
NON_REGRESSION |
1 10-6 |
||
FLEXION POS. - PHASE CHAR. ELAS . \(t=\mathrm{2,25}\) |
||||
Relative moment difference \({M}_{\mathrm{yy}}\) |
|
0 |
3 10-2 |
|
Relative difference in rotations \(\mathrm{DRX}\) |
|
1 10-6 |
||
FLEXION POS. - PHASE CHAR. ENDO . \(t=\mathrm{3,0}\) |
||||
Relative moment difference \({M}_{\mathrm{yy}}\) |
|
0 |
2 10-2 |
|
Relative difference in rotations \(\mathrm{DRX}\) |
|
1 10-6 |
||
FLEXION POS. - PHASE DECHAR. ELAS. \(t=\mathrm{3,5}\) |
||||
Relative moment difference \({M}_{\mathrm{yy}}\) |
|
0 |
6 10-1 |
|
Relative difference in rotations \(\mathrm{DRX}\) |
|
1 10-6 |
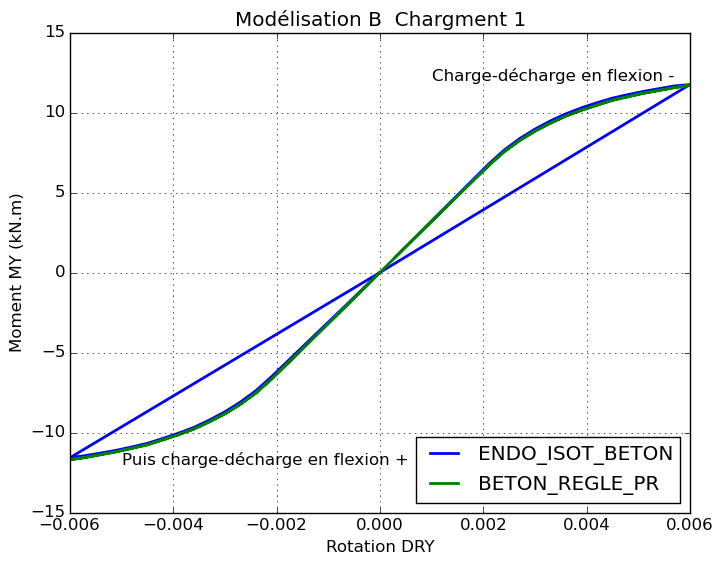
Comparative moment/rotation diagrams in cyclic bending for load \(\mathrm{f1}\) :
refill
(opposite bending)
Comparative graphs rotation \(\mathrm{DRX}\) (due to the Poisson effect) as a function of time for loading \(\mathrm{f1}\) :

4.4. Tested quantities and results for the f2 loading function#
We compare the moments along the \(\mathrm{Oy}\) axis in \(\mathit{A1}\mathrm{-}\mathit{A3}\) and the rotations along the \(\mathrm{Ox}\) en \(\mathit{A4}\) axis obtained by multilayer modeling with the ENDO_ISOT_BETON law and by that based on the BETON_REGLE_PR law, in terms of relative differences; some tolerances are taken in absolute value:
Identification |
Reference type |
Reference value |
Tolerance |
|
FLEXION NEG. - PHASE CHAR. ELAS . \(t=\mathrm{0,25}\) |
||||
Relative moment difference \({M}_{\mathrm{yy}}\) |
|
0 |
3 10-2 |
|
Relative difference in rotations \(\mathrm{DRX}\) |
|
1 10-6 |
||
FLEXION NEG. - PHASE CHAR. ENDO . \(t=\mathrm{1,0}\) |
||||
Relative moment difference \({M}_{\mathrm{yy}}\) |
|
0 |
1 10-2 |
|
Relative difference in rotations \(\mathrm{DRX}\) |
|
1 10-6 |
||
FLEXION NEG. - PHASE DECHAR. ELAS . \(t=\mathrm{1,5}\) |
||||
Relative moment difference \({M}_{\mathrm{yy}}\) |
|
0 |
6 10-1 |
|
Relative difference in rotations \(\mathrm{DRX}\) |
|
1 10-6 |
||
FLEXION POS. - PHASE CHAR. ELAS . \(t=\mathrm{2,25}\) |
||||
Relative moment difference \({M}_{\mathrm{yy}}\) |
|
0 |
3 10-2 |
|
Relative difference in rotations \(\mathrm{DRX}\) |
|
1 10-6 |
||
FLEXION POS. - PHASE CHAR. ENDO . \(t=\mathrm{3,0}\) |
||||
Relative moment difference \({M}_{\mathrm{yy}}\) |
|
0 |
2 10-2 |
|
Relative difference in rotations \(\mathrm{DRX}\) |
|
1 10-6 |
||
FLEXION POS. - PHASE DECHAR. ELAS . \(t=\mathrm{3,5}\) |
||||
Relative moment difference \({M}_{\mathrm{yy}}\) |
|
0 |
6 10-1 |
|
Relative difference in rotations \(\mathrm{DRX}\) |
|
1 10-6 |
It is verified that these results are identical to those obtained with load \(\mathrm{f1}\) (in the opposite direction).
4.5. Tested quantities and results for the f3 loading function#
We compare the moments along the \(\mathrm{Oy}\) axis in \(\mathit{A1}\mathrm{-}\mathit{A3}\) and the rotations along the \(\mathrm{Ox}\) axis in \(\mathit{A4}\) obtained by multilayer modeling with the ENDO_ISOT_BETON law and by the one based on the BETON_REGLE_PR law, in terms of relative differences:
Identification |
Reference type |
Reference value |
Tolerance |
|
FLEXION NEG. - PHASE CHAR. ELAS . \(t=\mathrm{4,25}\) |
||||
Relative moment difference \({M}_{\mathrm{yy}}\) |
|
0 |
7 10-1 |
|
Relative difference in rotations \(\mathrm{DRX}\) |
|
1 10-6 |
||
FLEXION NEG. - PHASE CHAR. ENDO . \(t=\mathrm{5,0}\) |
||||
Relative moment difference \({M}_{\mathrm{yy}}\) |
|
0 |
3 10-2 |
|
Relative difference in rotations \(\mathrm{DRX}\) |
|
1 10-6 |
||
FLEXION NEG. - PHASE DECHAR. ELAS . \(t=\mathrm{1,5}\) |
||||
Relative moment difference \({M}_{\mathrm{yy}}\) |
|
0 |
6 10-1 |
|
Relative difference in rotations \(\mathrm{DRX}\) |
|
1 10-6 |
||
FLEXION POS. - PHASE CHAR. ELAS . \(t=\mathrm{2,25}\) |
||||
Relative moment difference \({M}_{\mathrm{yy}}\) |
|
0 |
3 10-2 |
|
Relative difference in rotations \(\mathrm{DRX}\) |
|
1 10-6 |
||
FLEXION POS. - PHASE CHAR. ENDO . \(t=\mathrm{3,0}\) |
||||
Relative moment difference \({M}_{\mathrm{yy}}\) |
|
0 |
2 10-2 |
|
Relative difference in rotations \(\mathrm{DRX}\) |
|
1 10-6 |
||
FLEXION POS. - PHASE DECHAR. ELAS . \(t=\mathrm{3,5}\) |
||||
Relative moment difference \({M}_{\mathit{yy}}\) |
|
0 |
6 10-1 |
|
Relative difference in rotations \(\mathit{DRX}\) |
|
1 10-6 |
Comparative moment/rotation diagrams in cyclic bending for load \(\mathit{f3}\) :

Comparative graphs rotation \(\mathit{DRX}\) (due to the Poisson effect) as a function of time for loading \(\mathit{f3}\) :

4.6. notes#
According to the previous curves, it can be seen that the multilayer model with law BETON_REGLE_PR represents the overall behavior of reinforced concrete under bending —+ in a satisfactory manner under load. However, in discharge, law BETON_REGLE_PR follows the same curve as the charge, unlike law ENDO_ISOT_BETON.
The Poisson effect is not modelled by law BETON_REGLE_PR, so we get zero rotation in the DRX direction.
We observe a symmetry of the response according to the chosen direction of load (flexure — and +) or the opposite case, depending on the load \(\mathit{f1}\) or \(\mathit{f2}\) for law BETON_REGLE_PR.