6. D modeling#
6.1. Characteristics of modeling#
This is the same modeling as C modeling.
6.2. Characteristics of the mesh#
The mesh, which comprises 162 cells of the TETRA4 type, is represented in FIG. 6.2-a. The mesh is sufficiently unrefined to find itself in the same situation as in modeling A.
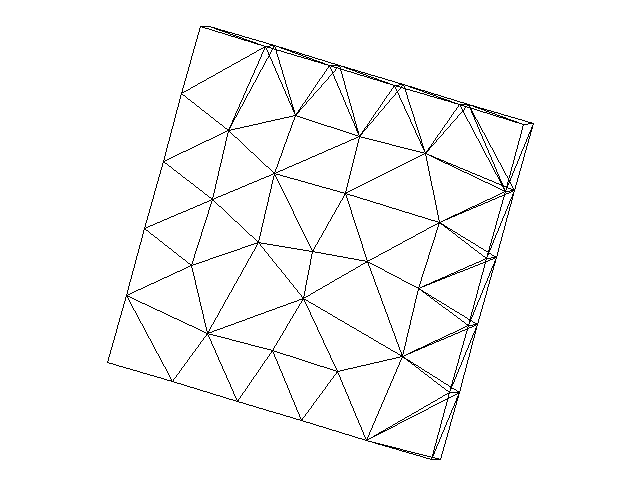
Figure 6.2-a: The modeling mesh D.
6.3. Tested sizes and results#
The quantities tested are identical to those presented for the C modeling.
Identification |
Reference |
% tolerance |
1.00E-11 |
|
DEPZON_1 |
DX |
MIN |
-0.25 |
|
MAX |
-0.25 |
1.00E-11 |
||
DY |
MIN |
0 |
1.00E-11 |
|
MAX |
0 |
1.00E-11 |
||
DEPZON_2 |
DX |
MIN |
-0.5 |
1.00E-11 |
MAX |
-0.5 |
1.00E-11 |
||
DY |
MIN |
0 |
1.00E-11 |
|
MAX |
0 |
1.00E-11 |
||
DEPZON_3 |
DX |
MIN |
0.75 |
1.00E-11 |
MAX |
0.75 |
1.00E-11 |
||
DY |
MIN |
0 |
1.00E-11 |
|
MAX |
0 |
1.00E-11 |
||
DEPZON_4 |
DX |
MIN |
0.75 |
1.00E-11 |
MAX |
0.75 |
1.00E-11 |
||
DY |
MIN |
0 |
1.00E-11 |
|
MAX |
0 |
1.00E-11 |
||
Table 6.3-1
The deformation is represented in FIG. 6.4-a.
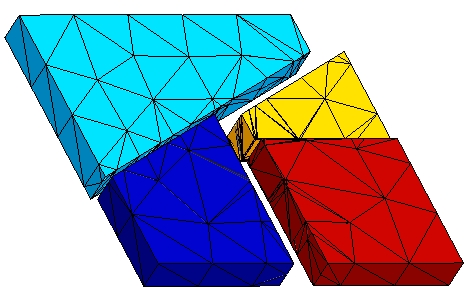
Figure 6.4-a: Deformed structure.
6.4. notes#
The remarks are identical to those specified for modeling A.