12. J modeling#
12.1. Characteristics of modeling#
It is the same modeling as the F modeling.
12.2. Characteristics of the mesh#
The mesh, identical to that of modeling E, is represented in FIG. 7.2-a. The mesh is less refined than that of the F modeling, so that some elements see the two horizontal cracks.
12.3. Tested sizes and results#
The quantities tested are identical to those presented for the F modeling.
Identification |
Reference |
% tolerance |
7.0 |
|
DEPZON_1 |
DX- \({u}_{x}\) |
MIN |
0 |
|
MAX |
0 |
7.0 |
||
DY- \({u}_{y}\) |
MIN |
0 |
7.0 |
|
MAX |
0 |
7.0 |
||
DEPZON_2 |
DX- \({u}_{x}\) |
MIN |
0 |
7.0 |
MAX |
0 |
7.0 |
||
DY- \({u}_{y}\) |
MIN |
0 |
7.0 |
|
MAX |
0 |
7.0 |
||
DEPZON_3 |
DX- \({u}_{x}\) |
MIN |
0 |
7.0 |
MAX |
0 |
7.0 |
||
DY- \({u}_{y}\) |
MIN |
0 |
7.0 |
|
MAX |
0 |
7.0 |
||
DEPZON_4 |
DX- \({u}_{x}\) |
MIN |
0 |
7.0 |
MAX |
0 |
7.0 |
||
DY- \({u}_{y}\) |
MIN |
0 |
7.0 |
|
MAX |
0 |
7.0 |
||
Table 12.3-1
The deformation is represented in FIG. 12.4-a.
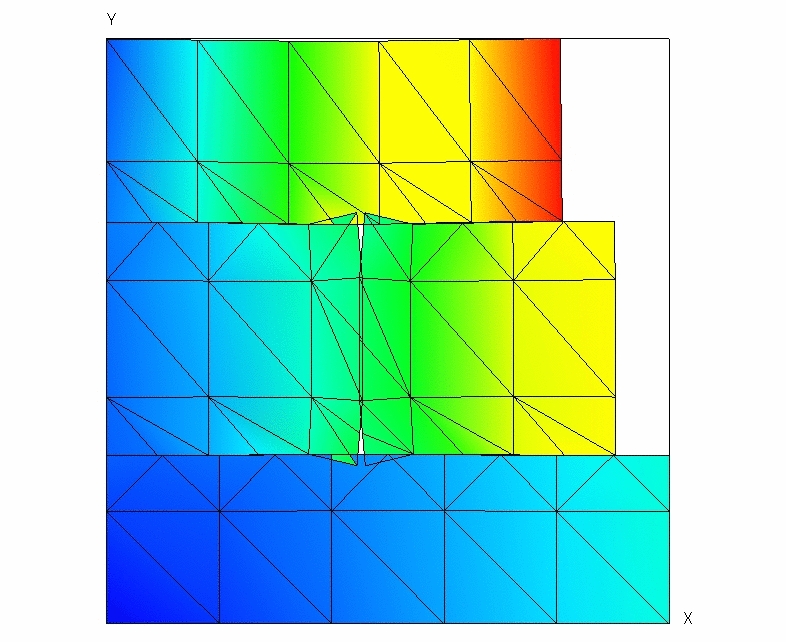
Figure 12.4-a: Deformed structure (Exaggeration 10).
12.4. notes#
The remarks are identical to those specified for the F model.