10. H modeling#
10.1. Characteristics of modeling#
It is the same modeling as the G modeling.
10.2. Characteristics of the mesh#
The mesh, identical to that of modeling D, is represented in FIG. 6.2-a.
10.3. Tested sizes and results#
The quantities tested are identical to those presented for the G modeling.
Identification |
Reference |
0 |
|
DEPZON_1 |
DX- \({u}_{x}\) |
MIN |
|
MAX |
0 |
||
DY- \({u}_{y}\) |
MIN |
0 |
|
MAX |
0 |
||
DZ- \({u}_{z}\) |
MIN |
0 |
|
MAX |
0 |
||
DEPZON_2 |
DX- \({u}_{x}\) |
MIN |
0 |
MAX |
0 |
||
DY- \({u}_{y}\) |
MIN |
0 |
|
MAX |
0 |
||
DZ- \({u}_{z}\) |
MIN |
0 |
|
MAX |
0 |
||
DEPZON_3 |
DX- \({u}_{x}\) |
MIN |
0 |
MAX |
0 |
||
DY- \({u}_{y}\) |
MIN |
0 |
|
MAX |
0 |
||
DZ- \({u}_{z}\) |
MIN |
0 |
|
MAX |
0 |
||
DEPZON_4 |
DX- \({u}_{x}\) |
MIN |
0 |
MAX |
0 |
||
DY- \({u}_{y}\) |
MIN |
0 |
|
MAX |
0 |
||
DZ- \({u}_{z}\) |
MIN |
0 |
|
MAX |
0 |
||
Table 10.3-1
The deformation is represented in FIG. 10.4-a.
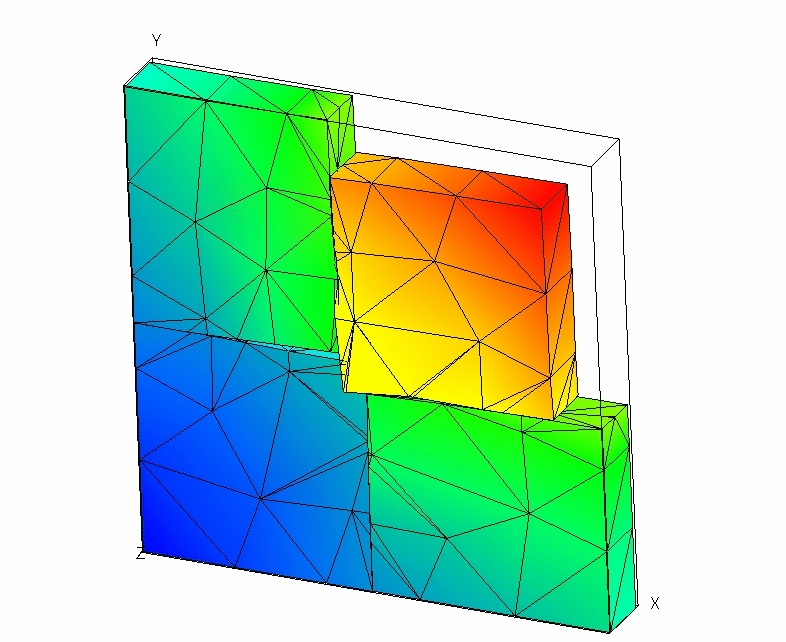
Figure 10.4-a: Deformed structure (Exaggeration 10).
We test the value of \({E}^{e}\) produced by the POST_ERREUR operator (expressed in \(\text{J}\)).
Identification |
Reference type |
Reference value |
Ee |
“ANALYTIQUE” |
1,825106 |
We test the value of \({\Vert u\Vert }_{{L}^{2}}\) produced by the POST_ERREUR operator.
10.4. notes#
The remarks are identical to those formulated for modeling E.