4. B modeling#
4.1. Characteristics of modeling#
It is the same modeling as modeling A, but with plane constraints. The intersection is constructed in the same way.
4.2. Characteristics of the mesh#
The mesh, which comprises 54 cells of the TRIA3 type, is represented in FIG. 4.2-a.
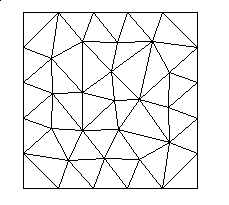
Figure 4.2-a: The modeling B mesh.
4.3. Tested sizes and results#
The quantities tested are identical to those presented for modeling A.
Identification |
Reference |
Reference type |
Precision |
10^ -12% |
|
DEPZON_1 |
DX |
MIN |
-0.25 |
“ANALYTIQUE” |
|
MAX |
-0.25 |
“ANALYTIQUE” |
10^ -12% |
||
DY |
MIN |
0 |
“ANALYTIQUE” |
10^ -12% |
|
MAX |
0 |
“ANALYTIQUE” |
10^ -12% |
||
DEPZON_2 |
DX |
MIN |
-0.5 |
“ANALYTIQUE” |
10^ -12% |
MAX |
-0.5 |
“ANALYTIQUE” |
10^ -12% |
||
DY |
MIN |
0 |
“ANALYTIQUE” |
10^ -12% |
|
MAX |
0 |
“ANALYTIQUE” |
10^ -12% |
||
DEPZON_3 |
DX |
MIN |
0.75 |
“ANALYTIQUE” |
10^ -12% |
MAX |
0.75 |
“ANALYTIQUE” |
10^ -12% |
||
DY |
MIN |
0 |
“ANALYTIQUE” |
10^ -12% |
|
MAX |
0 |
“ANALYTIQUE” |
10^ -12% |
||
DEPZON_4 |
DX |
MIN |
0.75 |
“ANALYTIQUE” |
10^ -12% |
MAX |
0.75 |
“ANALYTIQUE” |
10^ -12% |
||
DY |
MIN |
0 |
“ANALYTIQUE” |
10^ -12% |
|
MAX |
0 |
“ANALYTIQUE” |
10^ -12% |
||
Table 4.3-1
The deformation is represented in FIG. 4.4-a.
Figure 4.4-a: Deformed structure.
We test the value of \({E}^{e}\) produced by the POST_ERREUR operator.
Identification |
Reference type |
Reference value |
Ee |
“ANALYTIQUE” |
0 |
We test the value of \({\parallel u\parallel }_{{L}^{2}}\) produced by the POST_ERREUR operator.