9. G modeling#
9.1. Characteristics of modeling#
The modeling characteristics are the same as for modeling \(E\).
9.2. Characteristics of the mesh#
We discretize the structure in \(4\times (1\times 1\times 15)\) finite elements TETRA4. The interface is therefore present within the central elements through level sets.
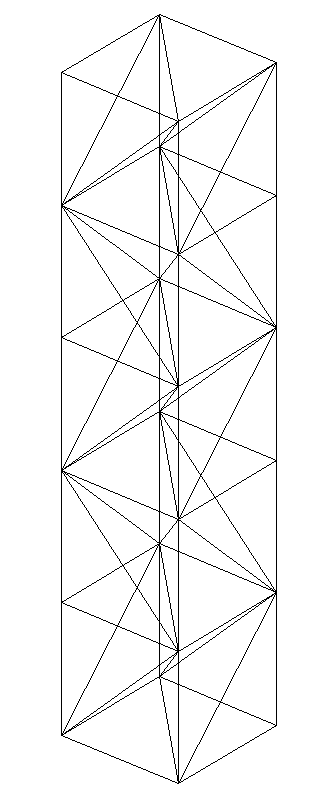
Figure 9.2-a : G modeling mesh
9.3. Piloting#
A specific control \(X-\mathrm{FEM}\) SAUT_LONG_ARC is used using the group of nodes located immediately above the crack.
9.4. Tested sizes and results#
Fashion \(I\):
The values of contact Lagrangians LAGS_C are tested at all the nodes of the mesh crossed by the interface after convergence of the iterations of each STAT_NON_LINE operator, these values being uniform on the interface. To test all the values at once, we test the minimum and the maximum number of contact Lagrangians.
No |
Identification |
Reference |
Tolerance (%) |
0.5 |
H1Z for all nodes |
1.36362396705485E-07 |
1.0E-6 |
0.5 |
|
3.66296853301E+05 |
1.0E-6 |
0.75 |
H1Z for all nodes |
6.818119835274E-08 |
1.0E-6 |
0.75 |
|
1.8314842665E+05 |
1.0E-6 |
2 |
H1Z for all nodes |
4.0908719011645E-07 |
1.0E-6 |
2 |
|
1.098890559903E+06 |
1.0E-6 |
3.5 |
H1Z for all nodes |
7.49999999999582E-04 |
1.0E-6 |
3,5 |
|
1.75867720687844E+05 |
1.0E-6 |
4.5 |
H1Z for all nodes |
2.49999999999582E-04 |
1.0E-6 |
4.5 |
|
58622.573562549 |
1.0E-6 |
5.5 |
H1Z for all nodes |
7.49999999999582E-04 |
1.0E-6 |
5,5 |
|
1.75867720687844E+05 |
1.0E-6 |
7 |
H1Z for all nodes |
1.49999999999958E-03 |
1.0E-6 |
7 |
|
28117.686527187 |
1.0E-6 |
9.5 |
H1Z for all nodes |
2.49999999999582E-04 |
1.0E-6 |
9.5 |
|
4686.28108785798 |
1.0E-6 |
12 |
H1Z for all nodes |
1.49999999999958E-03 |
1.0E-6 |
12 |
|
28117.686527187 |
1.0E-6 |
15 |
H1Z for all nodes |
2.99999999999958E-03 |
1.0E-6 |
15 |
|
718.731177854856 |
1.0E-6 |
Fashion \(\mathrm{II}\):
The values of the Lagrangian friction values LAGS_F1 are tested at all the nodes of the mesh crossed by the interface after convergence of the iterations of each STAT_NON_LINE operator, these values being uniform on the interface. To test all the values at once, we test the minimum and the maximum of the Lagrangian friction values.
No |
Identification |
Reference |
Tolerance (%) |
0.5 |
H1X for all nodes |
1.36362396705485E-07 |
1.0E-6 |
0.5 |
|
3.66296853301E+05 |
1.0E-6 |
0.75 |
H1X for all nodes |
6.818119835274E-08 |
1.0E-6 |
0.75 |
|
1.8314842665E+05 |
1.0E-6 |
2 |
H1X for all nodes |
4.0908719011645E-07 |
1.0E-6 |
2 |
|
1.098890559903E+06 |
1.0E-6 |
3.5 |
H1X for all nodes |
7.49999999999582E-04 |
1.0E-6 |
3,5 |
|
1.75867720687844E+05 |
1.0E-6 |
4.5 |
H1X for all nodes |
2.49999999999582E-04 |
1.0E-6 |
4.5 |
|
58622.573562549 |
1.0E-6 |
5.5 |
H1X for all nodes |
7.49999999999582E-04 |
1.0E-6 |
5,5 |
|
1.75867720687844E+05 |
1.0E-6 |
7 |
H1X for all nodes |
1.49999999999958E-03 |
1.0E-6 |
7 |
|
28117.686527187 |
1.0E-6 |
9.5 |
H1X for all nodes |
2.49999999999582E-04 |
1.0E-6 |
9.5 |
|
4686.28108785798 |
1.0E-6 |
12 |
H1X for all nodes |
1.49999999999958E-03 |
1.0E-5 |
12 |
|
28117.686527187 |
1.0E-5 |
15 |
H1X for all nodes |
2.99999999999958E-03 |
1.0E-5 |
15 |
|
718.731177854856 |
1.0E-5 |
9.5. Comments#
The contact and friction values of the Lagrangians are calculated explicitly as a function of the displacement jump that is controlled. It is therefore natural to have almost zero errors.