2. Benchmark solution#
2.1. Comparing tests and simulations#
We focused on two \(\omega \mathrm{=}{\sigma }_{2}\mathrm{/}{\sigma }_{1}\) ratio values corresponding to a bi-compression test (\(\omega \mathrm{=}0.52\)) and a traction-compression test (\(\omega \mathrm{=}\mathrm{-}0.052\)). The following figure shows the various results obtained:
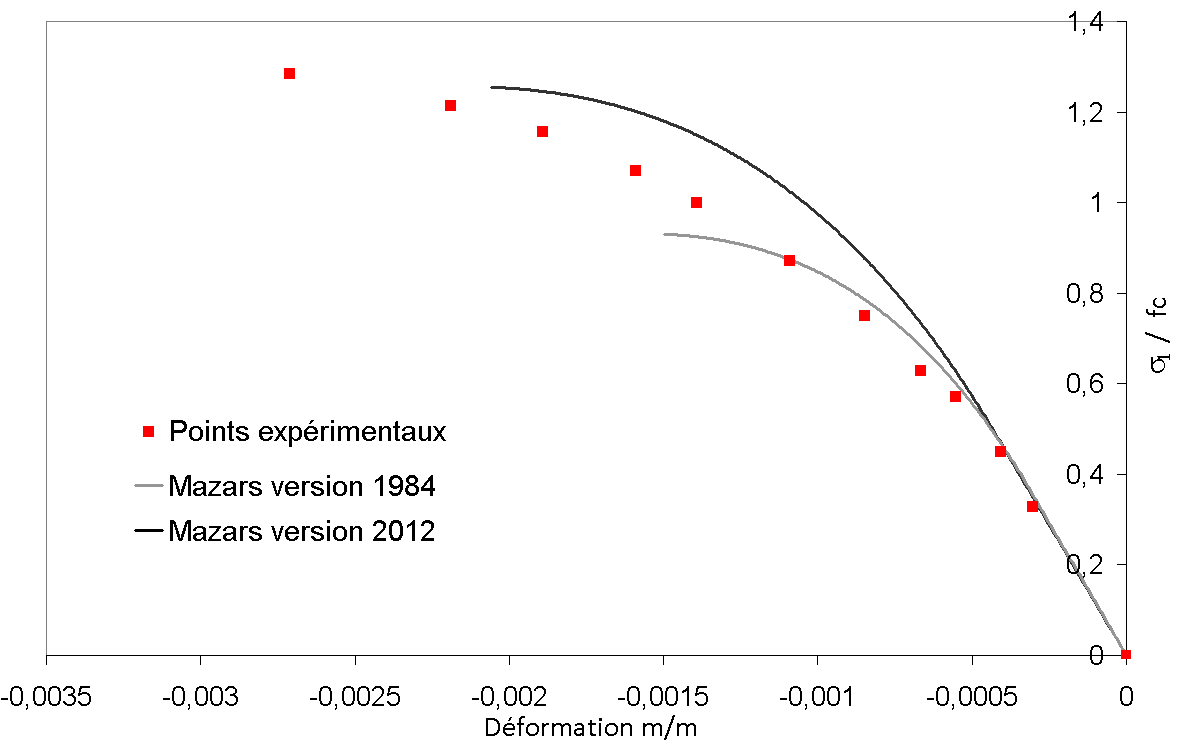
Figure 2.1-a :Comparison of experimental and numerical curves during the biaxial test ( \(\omega \mathrm{=}0.52\) )
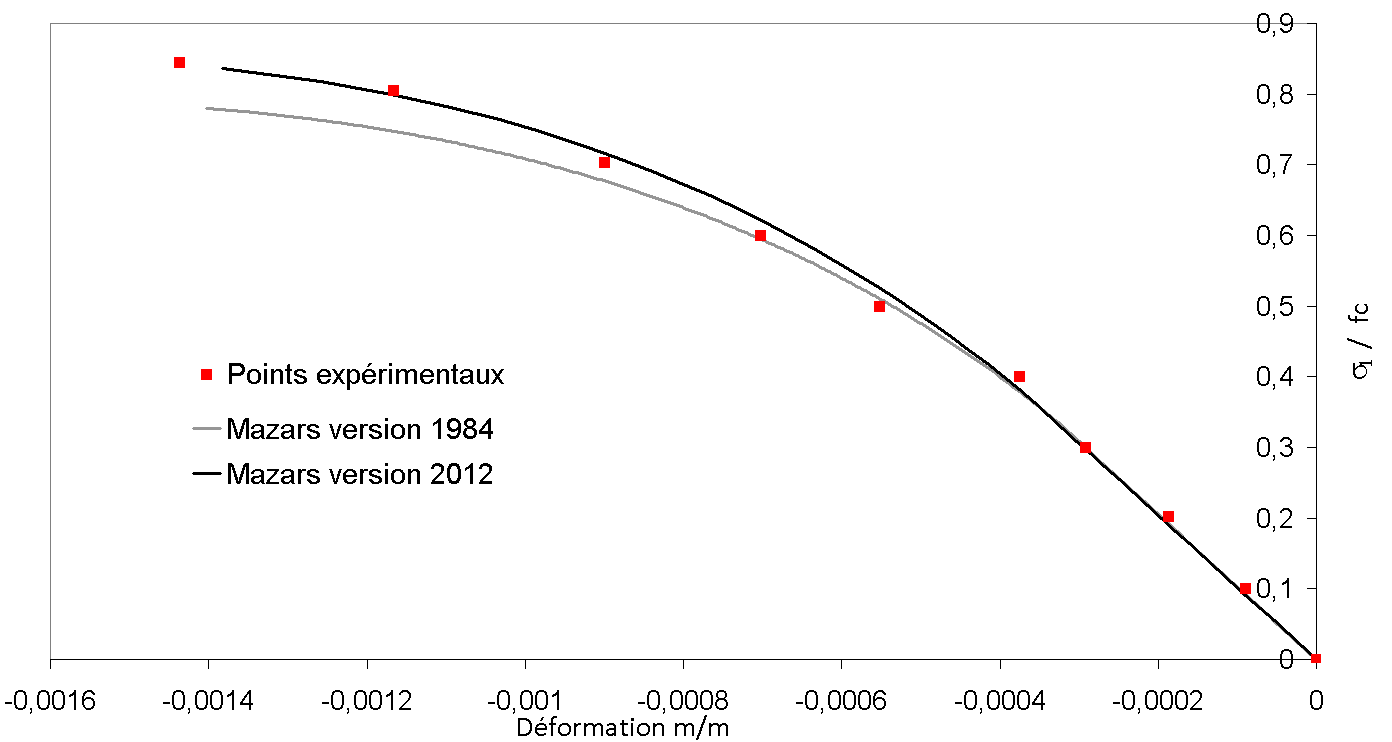
Figure 2.1-b: Comparison of experimental and numerical curves during the biaxial test \(\omega \mathrm{=}0.52\)
It should be noted that the simulations are controlled in force. As a result, it is not possible to model the softening phase. For report \(\omega \mathrm{=}0.52\), the failure to take into account the model of the evolution of the Poisson’s ratio under bi-compression does not make it possible to find long-term deformations. However, the numerical results are close to the experimental points at the start of the simulation. In addition, the Mazars model makes it possible to recover the experimental failure stress (the last experimental point corresponds to the rupture of the sample). Then, for ohm = -0.052, the model provides results that are very similar to the test.
Note: Until the stable 11.2 version of Code_Aster, the Mazars model followed the equations defined in Mazars” 1984 thesis [2]. Recently, a reformulation was proposed in order to fill certain shortcomings of the 1984 model, namely the description of the behavior of concrete under bi-compression and in pure shear. This 2012 release was implemented as of STA 11.3. It is possible to compare the responses of the different versions of the Mazars model in order to highlight the improvements of the 2012 version. It is clear that the 1984 Mazars model underestimates the resistance in bi-compression. Then, for \(\omega \mathrm{=}\mathrm{-}0.052\), the differences between the results from the two models are small. Recall that the improvements of the 2012 model concern in particular the behavior under bi-compression and in pure shear. Therefore, this result is logical. The curve obtained from the 2012 Mazars model is still closer to the experimental points.
2.2. Bibliographical references#
Kupfer, H.K. Hilsdorf, H. Rüsch, H. Rüsch, « Behavior of Concrete under Biaxial Stresses », ACI Journal, Vol. 66, No. 66-62, 1969, 1969, pp. 656-666.
Mazars, « A description of micro and macroscale damage of concrete structure », Engineering Fracture Mechanics, Vol25, 1986, p729-737.
Mazars, F. Hamon, « A new strategy to formulate a 3D damage model for concrete under monotonic, cyclic and severe loadings », Engineering Structures, 2012, Under Review