4. B modeling#
4.1. Characteristics of modeling#
The beam is modelled by elements DKTG and GRILLE_EXCENTREE. 16 elements are used in the longitudinal direction \(X\) and only one in the transverse direction \(Z\).
Reinforced concrete is modelled by behavior law GLRC_DM. The parameters of the law of behavior GLRC_DM are obtained using the DEFI_GLRC macro-command. The material data used is defined in 1.2. For the reinforcement layers of model GLRC, a reinforcement section \(\mathit{OMX}\mathrm{=}\mathit{OMY}\mathrm{=}\mathrm{8,04E-4}\mathit{m²}\mathrm{/}m\) and the eccentricity \(\mathit{RX}\mathrm{=}\mathit{RY}\mathrm{=}\mathrm{0,872}\) are defined. We use option PENTE =_F (
TRACTION =” PLAS_ACIER “,
FLEXION = “UTIL”,
KAPPA_FLEX = 3E-3,
),
The first two natural frequencies (calculated with*Code_Aster*) are \({f}_{1}=38.7\mathit{Hz}\) and \({f}_{2}=153.2\mathit{Hz}\). For modal depreciations of 5%, the damping coefficients \(\alpha =8{.10}^{-5}\) and \(\beta =20\) are obtained. These coefficients are supplied to the macro command DEFI_GLRC.
4.2. Tested sizes and results#
The reaction curves as a function of time as well as the arrow in the center as a function of time are shown in figures to.
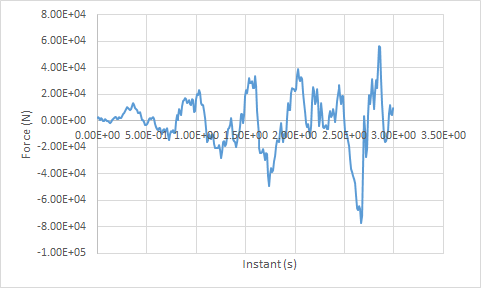
Figure 4.2-a: Press reaction in A as a function of time for the first three seconds.
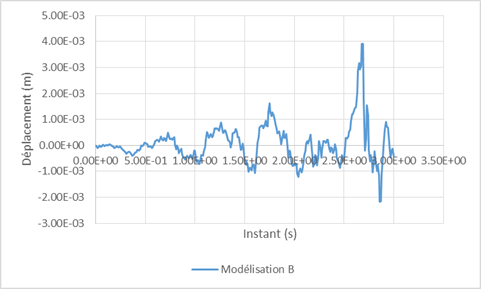
Figure 4.2-b: f arrow in the center according to the time for the first three seconds.
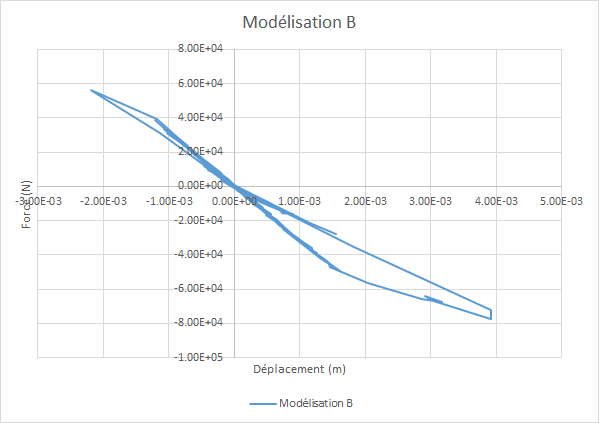
Figure 4.2-c: reaction-arrow curve for the first three seconds.
The tests are carried out for the reaction on the first press and the arrow in the center. These values are tested for a few moments in the first three seconds of the earthquake, i.e. at times \(\mathrm{1.76s}\) (at the very beginning of the non-linear domain), then \(\mathrm{2.05s}\), \(\mathrm{2.68s}\) and \(\mathrm{2.87s}\) when the structure is already heavily damaged.
Instant |
Size |
Location |
Reference Type |
Tolerance |
|
1.76 s |
FORC_NODA: DY |
Group:AA |
NON_REGRESSION |
1.0E-06 |
1.0E-06 |
1.76 s |
DEPL: DY |
Group:CC |
NON_REGRESSION |
1.0E-06 |
1.0E-06 |
2.05 s |
FORC_NODA: DY |
Group:AA |
NON_REGRESSION |
1.0E-06 |
|
2.05 s |
DEPL: DY |
Group:CC |
NON_REGRESSION |
1.0E-06 |
1.0E-06 |
2.68 s |
FORC_NODA: DY |
Group:AA |
NON_REGRESSION |
1.0E-06 |
|
2.68 s |
DEPL: DY |
Group:CC |
NON_REGRESSION |
1.0E-06 |
1.0E-06 |
2.87 s |
FORC_NODA: DY |
Group:AA |
NON_REGRESSION |
1.0E-06 |
1.0E-06 |
2.87 s |
DEPL: DY |
Group:CC |
NON_REGRESSION |
1.0E-06 |
1.0E-06 |
The figures below show the evolution of the reaction on support A and of the arrow in the center, for 15 seconds.
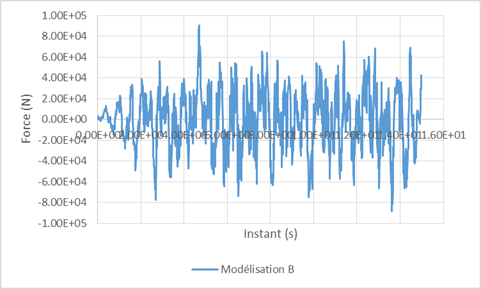
Figure 4.2-d: Press reaction in A as a function of time, for 15 seconds.
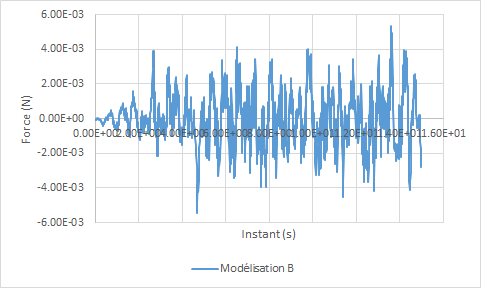
Figure 4.2-e : arrow in the center according to time, for 15 seconds.
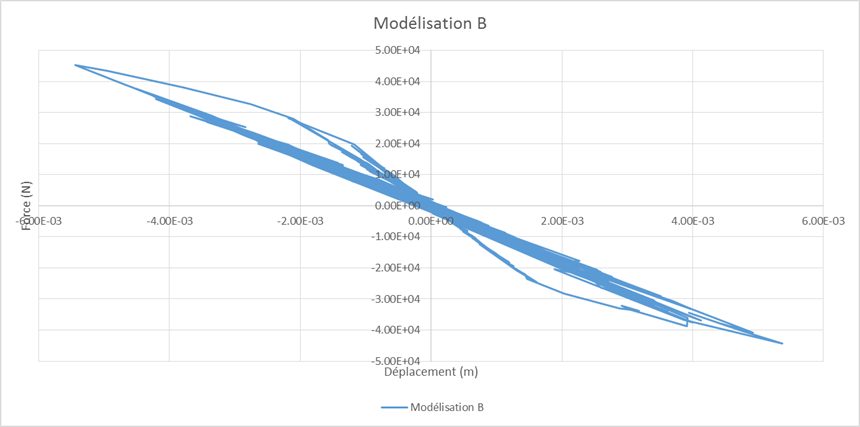
Figure 4.2-f: c**reaction-arrow curve, for 15 seconds.**