3. Modeling A#
3.1. Characteristics of modeling#
Longitudinal mesh of the beam:
It is composed of 17 nodes and 16 pairs of POU_D_EM elements (16 elements for concrete and 16 for steel).
Beam cross section:
The concrete is modelled by a mesh composed of \(2\mathrm{\times }20\) quadrilaterals (40 fibers).
Steel is modelled by 4 point fibers.
Depreciation coefficients \(\alpha\) and \(\beta\) are calculated using the following formula:
\(\left[\begin{array}{c}\alpha \\ \beta \end{array}\right]\mathrm{=}2\frac{{\omega }_{1}{\omega }_{2}}{{\omega }_{2}^{2}\mathrm{-}{\omega }_{1}^{2}}\left[\begin{array}{cc}\frac{\mathrm{-}1}{{\omega }_{2}}& \frac{1}{{\omega }_{1}}\\ {\omega }_{2}& \mathrm{-}{\omega }_{1}\end{array}\right]\left[\begin{array}{c}{\xi }_{1}\\ {\xi }_{2}\end{array}\right]\)
where \({\omega }_{1}\) and \({\omega }_{2}\) are the first two natural pulsations \((\omega \mathrm{=}2\pi f)\) and \({\xi }_{1}\) and \({\xi }_{2}\) are the desired damping on the first two modes.
With \({f}_{1}=39.9\mathrm{Hz}\) and \({f}_{2}=157.6\mathrm{Hz}\) (calculated with Code_Aster), for modal depreciations of \(\text{5\%}\), we find: \(\alpha ={8.10}^{-5}\) and \(\beta =20\).
The time step chosen is \(\mathrm{0,01}s\).
The law for the behavior of concrete is Mazars in version \(\mathrm{1D}\).
3.2. Tested sizes and results#
The support reaction curves as a function of time as well as the arrow in the center as a function of time are shown in figures to.
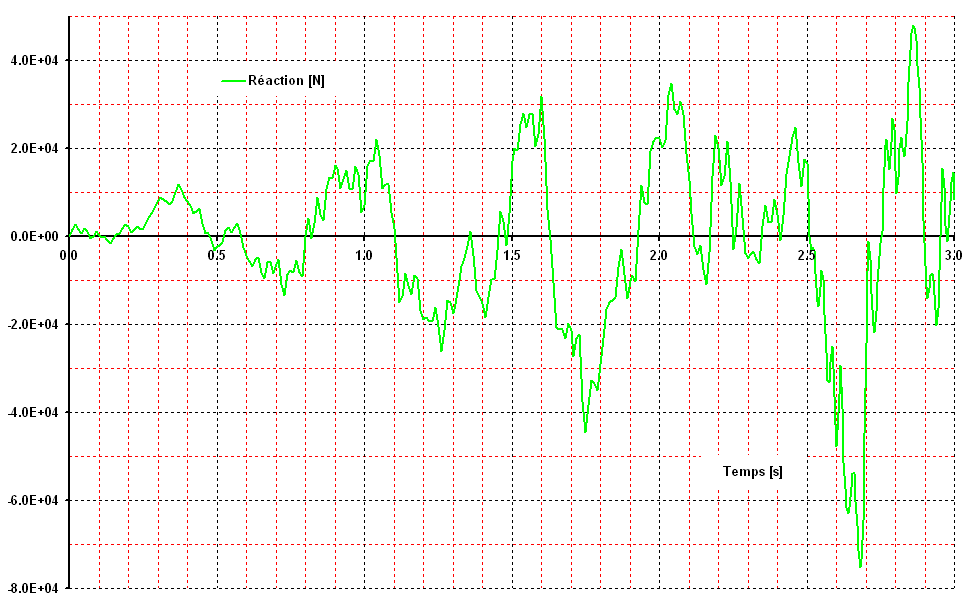
Figure 3.2-a: Press reaction A as a function of time for the first three seconds.
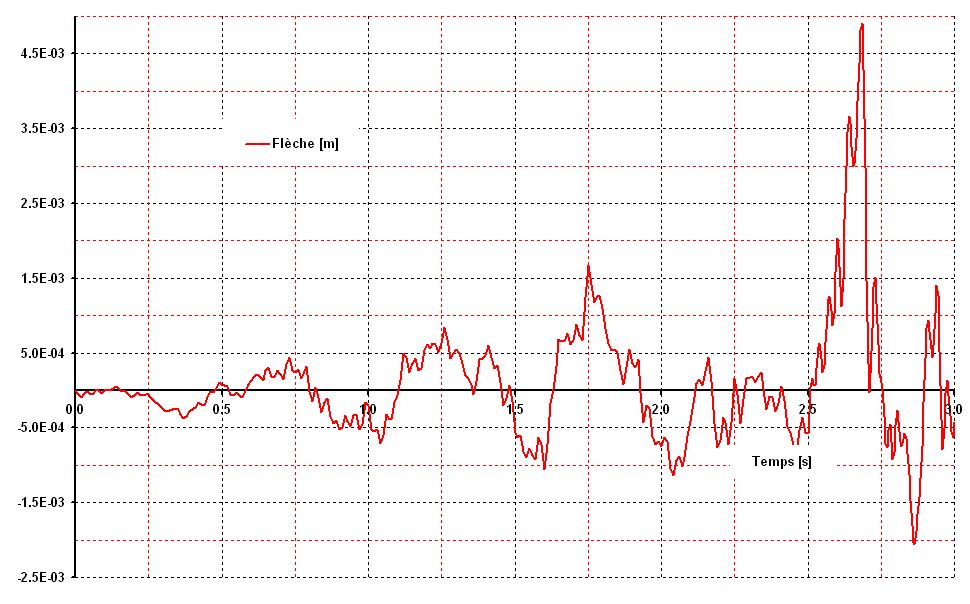
Figure 3.2-b: f arrow in the center according to the time for the first three seconds.
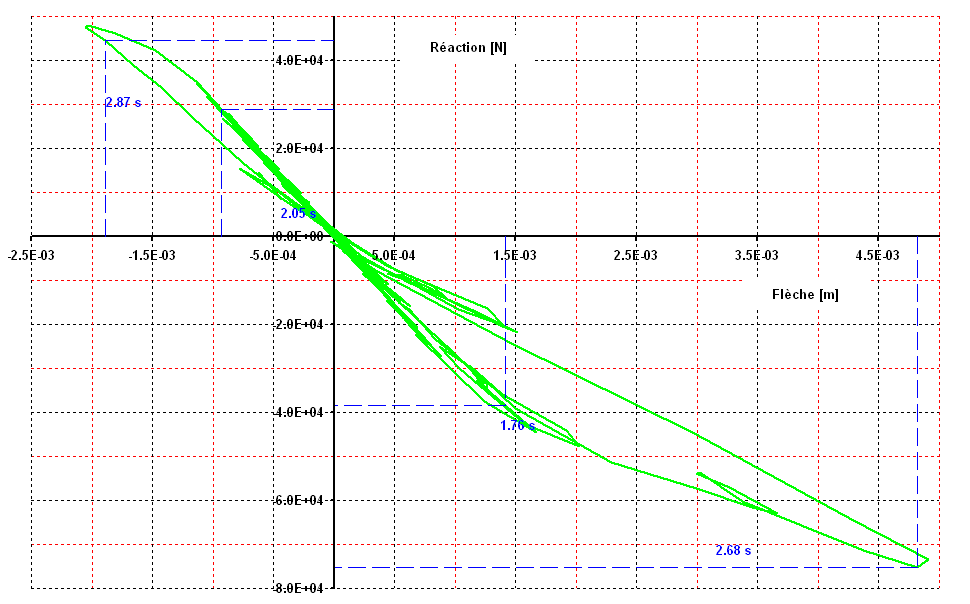
Figure 3.2-c: c Reaction-arrow curve for the first three seconds.
The tests are carried out for the reaction on the first press and the arrow in the center. These values are tested for a few moments in the first three seconds of the earthquake, i.e. at times \(\mathrm{1.76s}\) (at the very beginning of the non-linear domain), then \(\mathrm{2.05s}\), \(\mathrm{2.68s}\) and \(\mathrm{2.87s}\) when the structure is already heavily damaged.
Instant |
Size |
Location |
Reference Type |
Tolerance |
|
1.76 s |
FORC_NODA: DY |
group:A |
NON_REGRESSION |
1.0E-06 |
1.0E-06 |
1.76 s |
DEPL: DY |
Group:C |
NON_REGRESSION |
1.0E-06 |
1.0E-06 |
2.05 s |
FORC_NODA: DY |
group:A |
NON_REGRESSION |
1.0E-06 |
1.0E-06 |
2.05 s |
DEPL: DY |
Group:C |
NON_REGRESSION |
1.0E-06 |
|
2.68 s |
FORC_NODA: DY |
group:A |
NON_REGRESSION |
1.0E-06 |
1.0E-06 |
2.68 s |
DEPL: DY |
group:C |
NON_REGRESSION |
1.0E-06 |
1.0E-06 |
2.87 s |
FORC_NODA: DY |
group:A |
NON_REGRESSION |
1.0E-06 |
1.0E-06 |
2.87 s |
DEPL: DY |
group:C |
NON_REGRESSION |
1.0E-06 |
1.0E-06 |
The figures below show the evolution of the reaction on support A and of the arrow in the center, for 15 seconds.
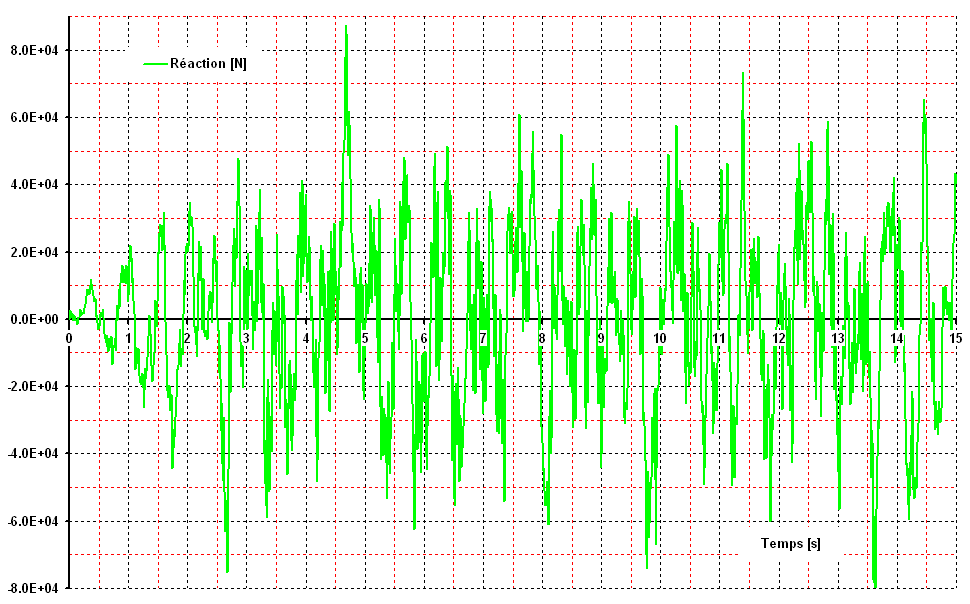
Figure 3.2-d: Press reaction in A as a function of time, for 15 seconds.
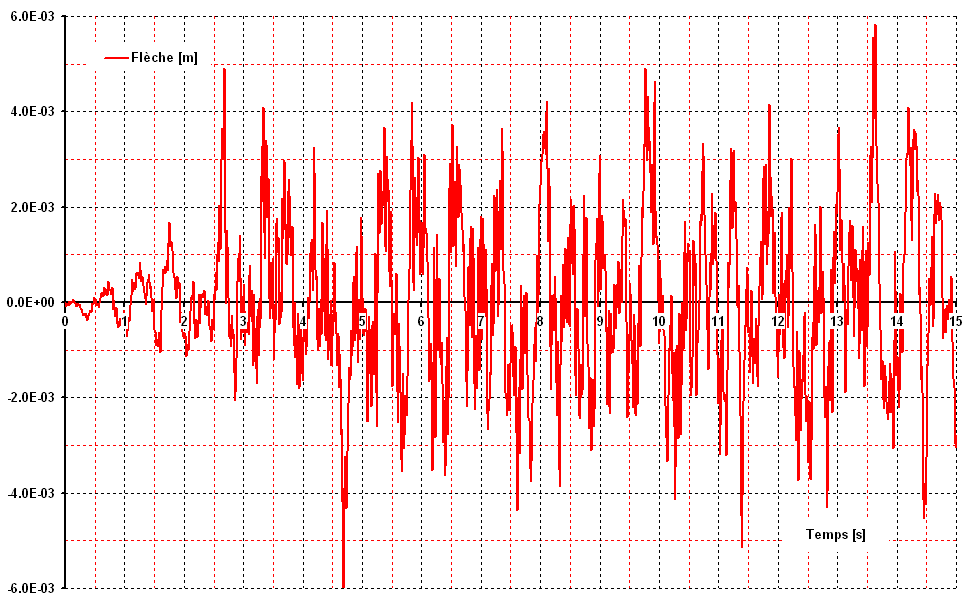
Figure 3.2-e: f arrow in the center as a function of time, for 15 seconds.
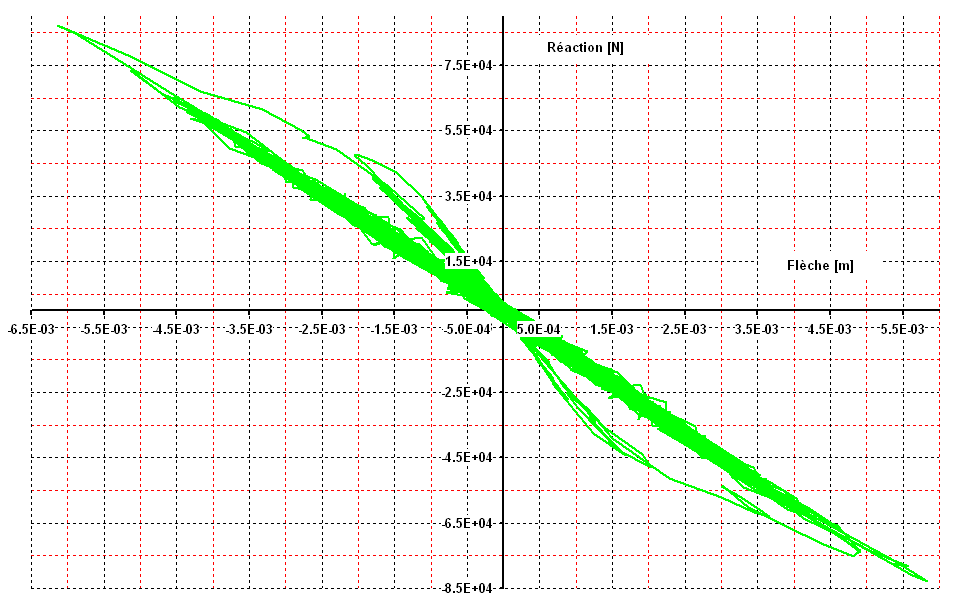
Figure 3.2-f: c**reaction-arrow curve, for 15 seconds.**