9. G modeling#
9.1. Characteristics of modeling#
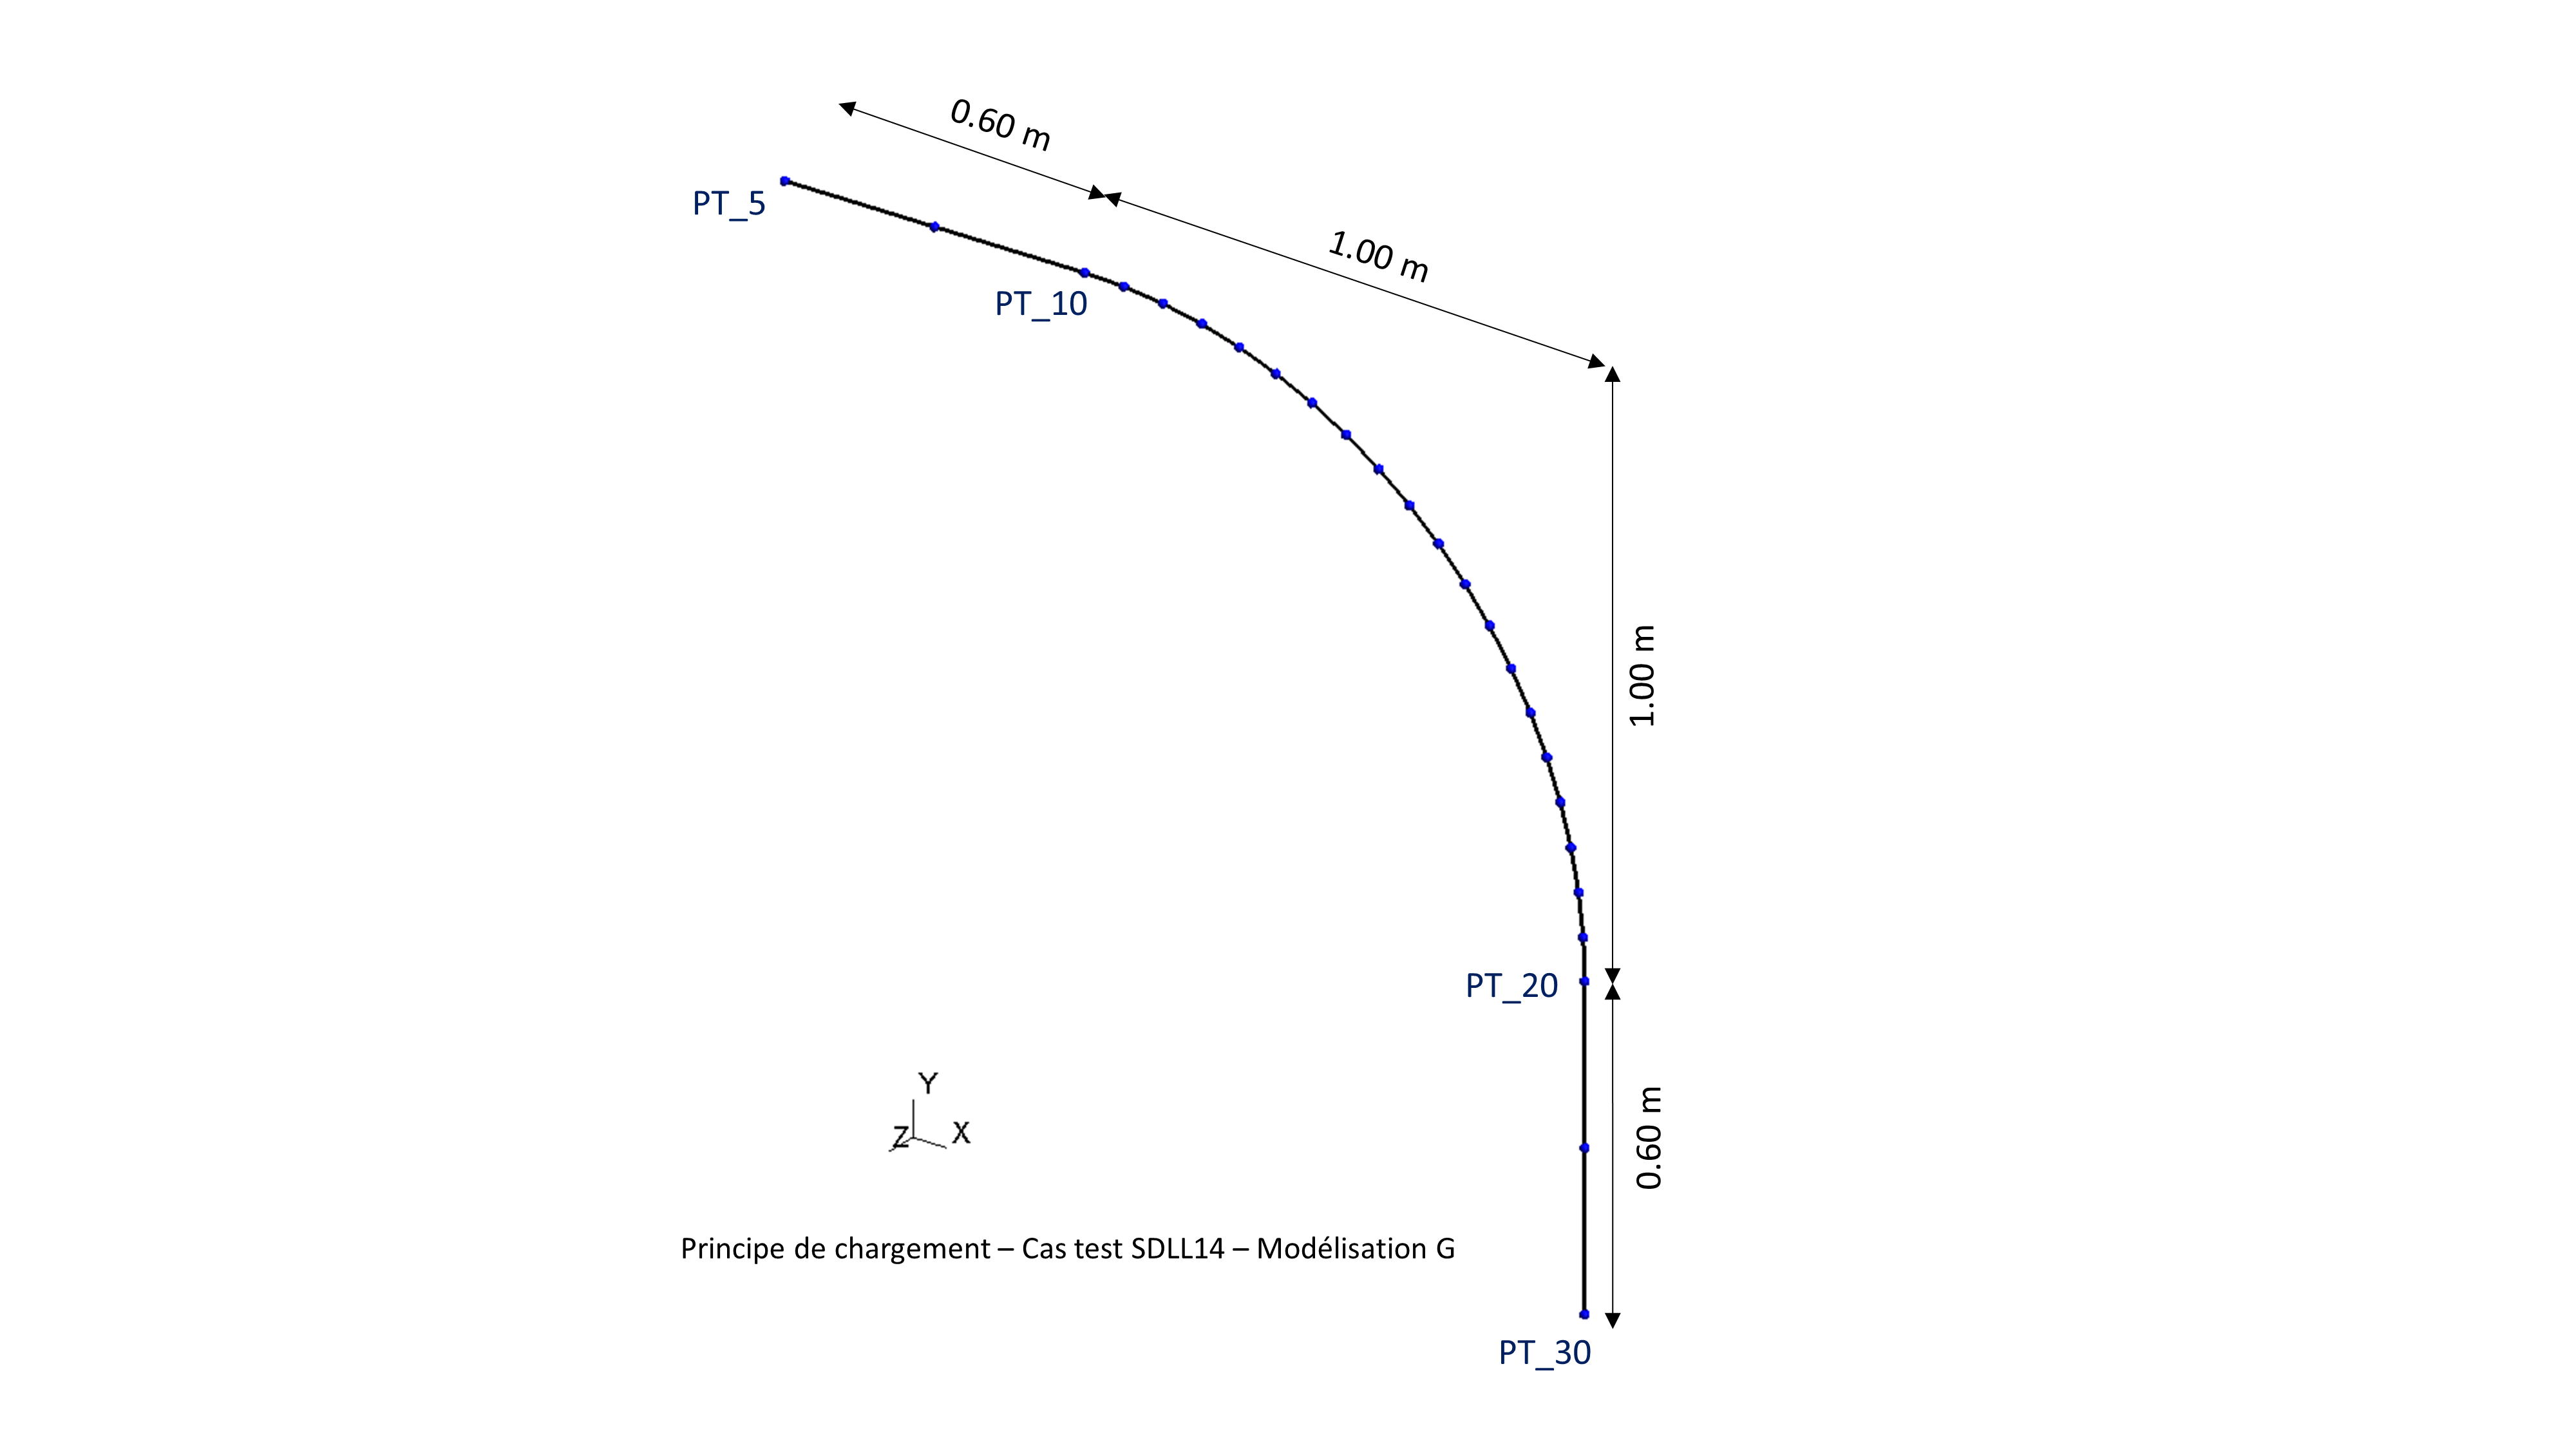
Figure 9.1-1
9.2. Boundary conditions#
Embedding PT_5 (DX=DY=DZ= DRX = = DRY = DRZ =0)
Support PT_10 (DY=DZ=0)
Support PT_20 (DX=DZ=0)
Embedding PT_30 (DX=DY=DZ= DRX = = DRY = DRZ =0)
9.3. Characteristics of the mesh#
Number of knots: 25
Number of meshes and types: 24 POU_D_T
9.4. Tested sizes and results#
Uncertainties about the results using the reference analytical solution:
Identification |
Reference AFNOR |
Pipestress Value |
Aster Value |
Aster Variance- AFNOR (%) |
|
Frequency (\(\mathit{Hz}\)) Mode 1 |
33.4 |
33.4 |
33.168 |
33.165 |
0.7035928 |
Frequency (\(\mathit{Hz}\)) Mode 2 |
94 |
94 |
93.989 |
93.882 |
0.1255319 |
Frequency (\(\mathit{Hz}\)) Mode 3 |
100 |
100 |
98.785 |
98.628 |
1.3720000 |
Frequency (\(\mathit{Hz}\)) Mode 4 |
180 |
180 |
181.979 |
182.542 |
1.4122222 |
Table 9.4-1
9.5. Deformed from mode 1#
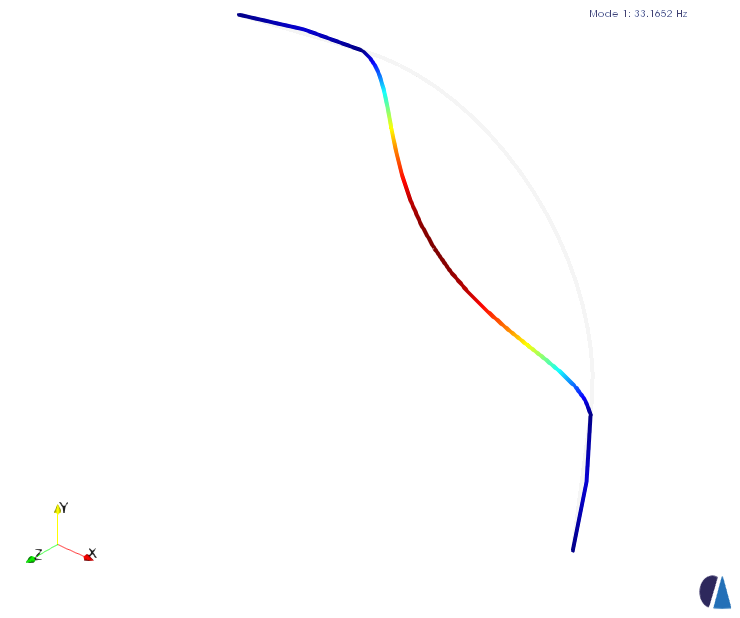
Figure 9.5-1