8. F modeling#
8.1. Characteristics of modeling#
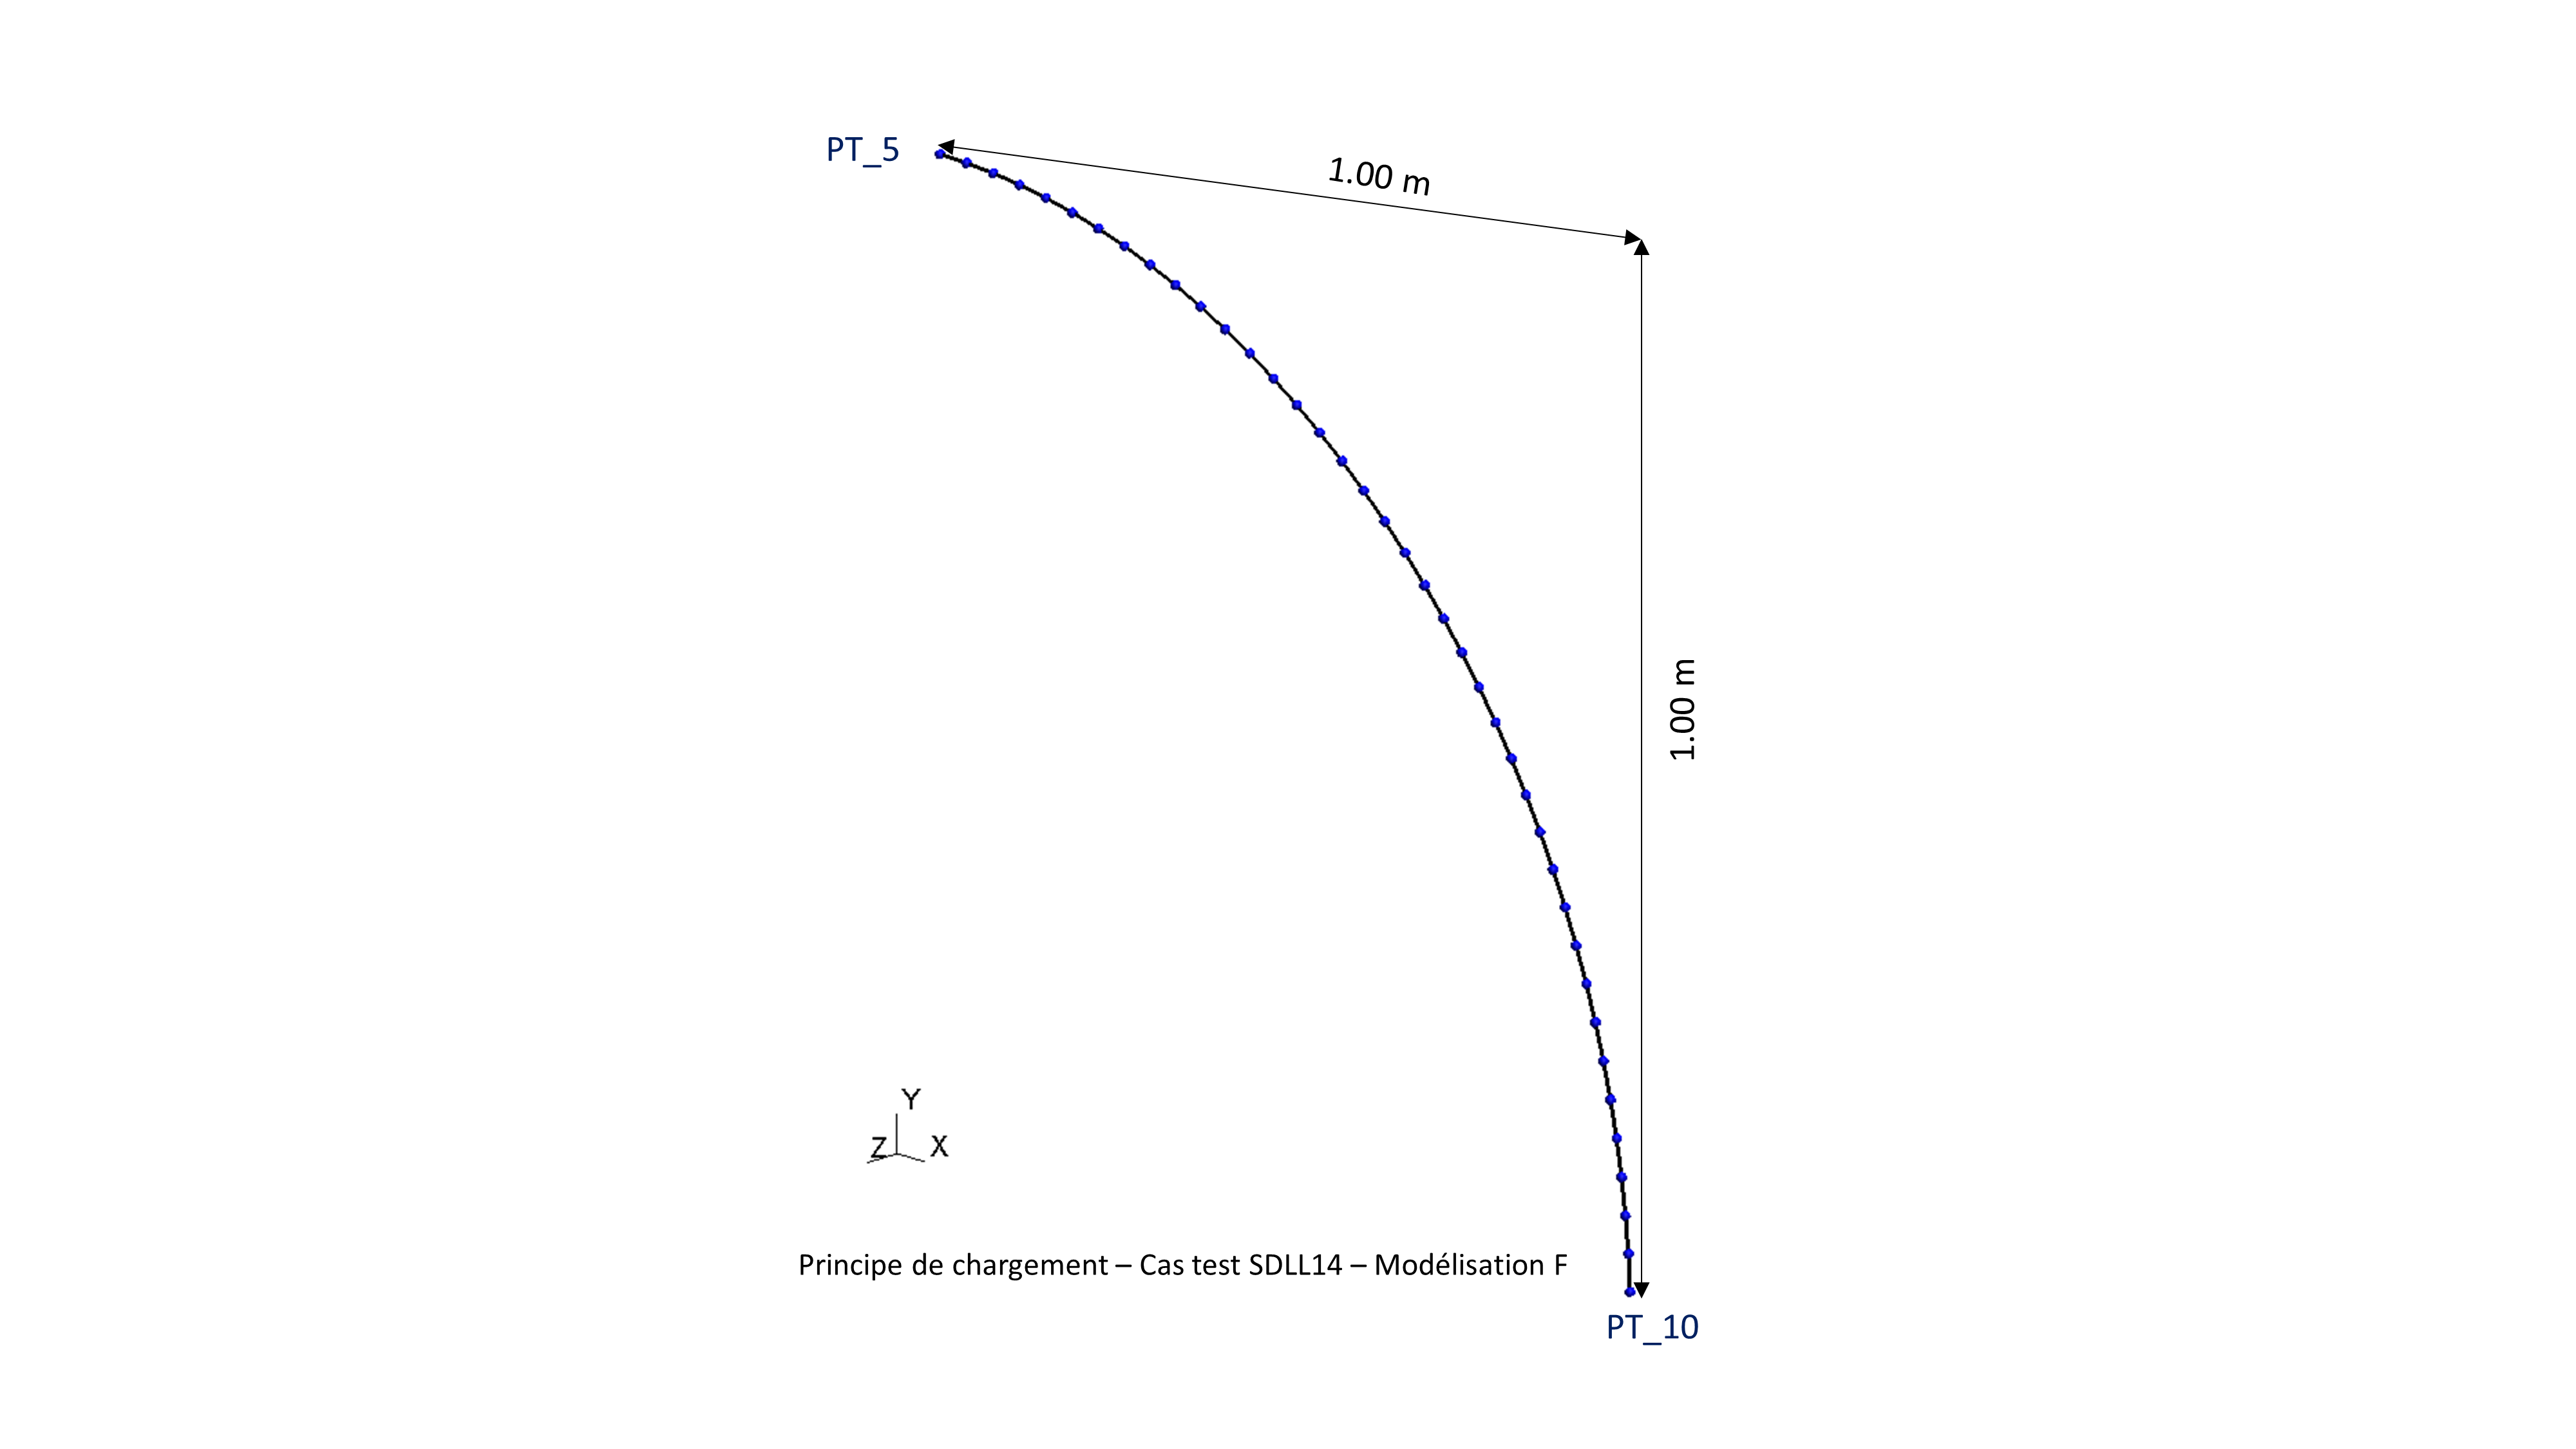
Figure 8.1-1
8.2. Boundary conditions#
Embedding PT_5 (DX=DY=DZ= DRX = = DRY = DRZ =0)
Embedding PT_10 (DX=DY=DZ= DRX = = DRY = DRZ =0)
8.3. Characteristics of the mesh#
Number of knots: 40
Number of meshes and types: 39 POU_D_T
8.4. Tested sizes and results#
Uncertainties about the results using the reference analytical solution:
Identification |
Reference AFNOR |
Pipestress Value |
Aster Value |
Aster Variance- AFNOR (%) |
||
Frequency (\(\mathit{Hz}\)) Mode 1 |
44.23 |
44.23 |
44.23 |
44.076 |
44.068 |
0.3662672 |
Frequency (\(\mathit{Hz}\)) Mode 2 |
119 |
119 |
119.028 |
119.016 |
0.0134454 |
|
Frequency (\(\mathit{Hz}\)) Mode 3 |
125 |
125.448 |
125.434 |
0.3472000 |
||
Frequency (\(\mathit{Hz}\)) Mode 4 |
227 |
227 |
224.426 |
224.443 |
1.1264317 |
Table 8.4-1
8.5. Deformed from mode 1#
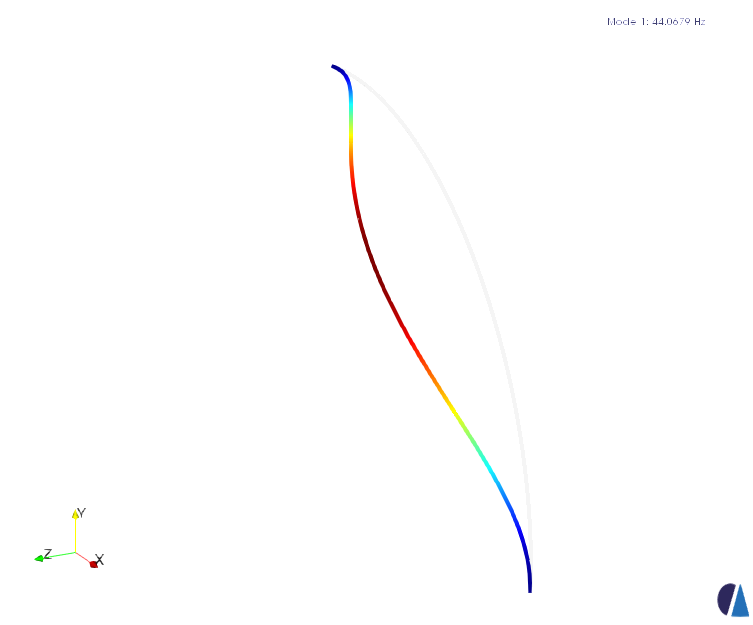
Figure 8.5-1