3. Organization of Grace in graphs and curves#
3.1. Generalities#
For Grace, a graph is a graph that can contain several curves, a Grace « project » (which can be saved in a file with the « agr » extension) can contain several graphs.
The graphs are named G0, G1,…
The curves are named S0, S1,…
3.2. Graph management#
The user can manage the graphs in each graph selection list (for example in the Edit/Arrange Graphs, Edit/Set Operations, Edit/Overlay Graphs, Plot/Graph Appearance as shown in the illustration below or Data/Import/Ascii menus).
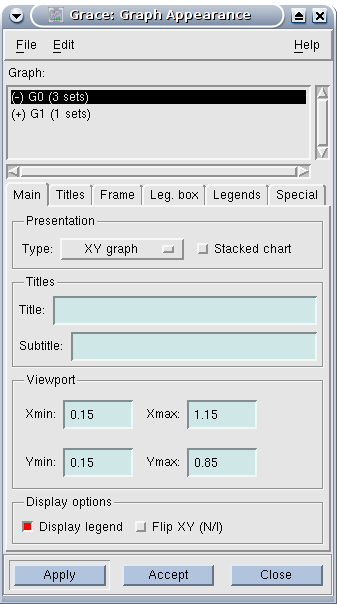
In the area below « Graph », there is a list of graphs (here, the project includes two graphs, the first including three curves, the second including a single curve). Note the « (-) » in front of the first graph, which means that the first graph is « hidden » (i.e. not displayed), while the (+) in front of the second graph means that it is displayed (showed). The graph (s) highlighted are the graph (s) concerned by the current action: here, the modification of the graph concerns G0 (even if it is hidden!). Likewise, when importing a curve:
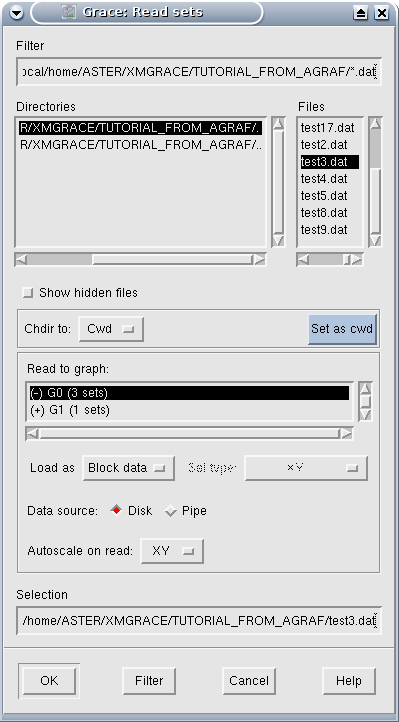
the curve that the user is preparing to import will go into the G0 graph (as before, this graph being hidden, the imported curve will not be displayed).
In some menus (Plot/Graph Appearance for example), it is possible to select several graphs (in the usual way: Ctrl + left click for a chart selection « one by one » or Shift + left click on the first and last element of a contiguous list or left click + mouse movement on a list…), while other menus (Data/Import/Ascii for example) allow only one selected graph.
An important (and not very intuitive) command is right-clicking on the graph list, which opens a menu with the following commands:
focus to: to define the active graph (useful if several graphs are displayed: the active graph is the one that receives the actions when the user uses the icons, in the same way to manage the curves of a graph, the graph must be the active graph);
hide: hide the graph;
show: show the graph;
duplicate: duplicate the graph and all its curves;
kill: destroy the graph;
swap: exchange two graphs (you need two highlighted graphs);
create new: create a new graph (empty).
In summary, to create a new graph, you must open the list of graphs (using for example Plot/Graph Appearance), right-click on the list of graphs and choose « Create New »). It should be noted that there is no menu allowing this action to be done directly.
3.3. Curve management#
The principle of managing curves is about the same as that for graphs. Grace displays the list of curves (of the active graph: be careful, once again, the active graph is not necessarily visible!) in the menus that manipulate the curves: Edit/Data Sets, Edit/Set Operations, Data/Data set operations, Plot/Set Appearance as in the following illustration:
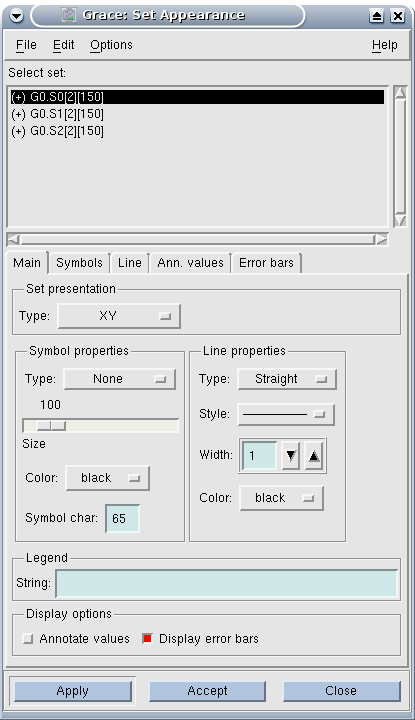
The active graph here is G0 (it is mentioned as a prefix for the curves in the list), it has three curves (note the mention, between brackets, behind the name of the curves of the dimension — here 2 for X and Y — and of the length — here, the curves all have 150 points -).
In the list of curves, right clicking opens a menu:
hide: hide the curve;
show: show the curve;
bring to front: put the curve in the foreground;
send to back: put the curve in the background;
duplicate: duplicate the curve;
kill: remove the curve;
kill data: delete the data but not the curve, i.e. all the formatting is retained, which can be very practical if the user has two identical graphs to create from different data: all you have to do is create a graph, then remove all the data with « kill data », import the second data series: the two graphs will have exactly the same appearance;
swap: exchange the position of the two curves
edit: edit the data;
create new: create a new curve;
pack all sets:?
selector operations: a kind of preference menu for displaying this list of curves.
Note:
All the previous operations on the curves are done within the same graph. In case the user needs to copy a curve from one graph to another, use the Edit/Set Operations menu.