3. Calculation of material parameters#
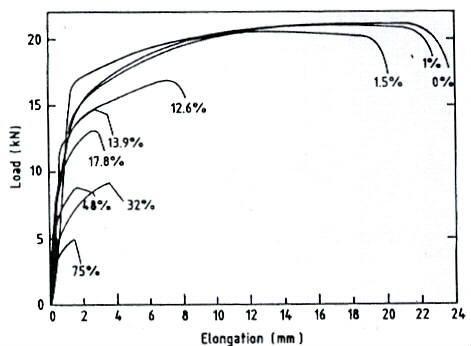
The results of A.A. Almusallam’s tensile tests [bib2] _ were used to identify the law of behavior of non-corroded steel and the dependence of plastic deformation at break on the corrosion rate.
3.1. Law of behavior of steel#
Non-alloy steel is the main type of steel used in building structures. The one-dimensional behavior model of non-alloy steel under unidirectional monotonic loading should be determined from the results of a tensile test on a non-corroded bar or flat specimen. An example of numerical simulation required to determine this law of behavior is presented on [Figure 3.2-a].
3.2. Taking corrosion into account#
The presence of corrosion has two effects on reinforcement in reinforced concrete structures:
a reduction in the section;
a reduction of \({\epsilon }_{R}\) based on \({T}_{c}\):
The reduction in section results in a reduction in the diameter for the bars or in a decrease in thickness for the sheets:
\({T}_{c}\text{=}\text{100}\left(\frac{{d}_{\text{corrodé}}^{2}}{{d}_{\text{noncorrodé}}^{2}}\right)\) or \({T}_{c}\text{=}\text{100}\left(\frac{{e}_{\text{corrodé}}}{{e}_{\text{noncorrodé}}}\right)\) eq 3.2- 1
Note: Section reduction is not treated at the behavior model level, it must be taken into account at the command file level in AFFE_CARA_ELEMpar example.
In the uniaxial case, the plastic deformation at break \({\varepsilon }_{R}\) depends on the corrosion rate. This evolution is presented on the [Figure 3.2-b].
Figure 3.2-a: Influence of corrosion on the behavior of steel as a function of the corrosion rate |
Figure 3.2-b: The evolution of plastic deformation at break as a function of the rate of corrosion |
From these experimental data (tensile tests), the variation in plastic deformation at break as a function of the corrosion rate is deduced:
\({T}_{c}<\text{15\%}\Rightarrow \text{}{\epsilon }_{R}\text{=-0}\text{.}\text{0111}\text{Tc+}0\text{.}\text{2345}\) eq 3.2- 2
\({T}_{c}>\text{15\%}\Rightarrow {\epsilon }_{R}\text{=-0}\text{.}\text{0006}\text{Tc+}0\text{.}\text{051}\) eq 3.2- 3
By analysis of various tensile tests, it is observed that the behavior of the corroded reinforcement is almost fragile and \({\epsilon }_{D}\text{=}0\text{.}8\phantom{\rule{0.5em}{0ex}}{\epsilon }_{R}\) (\({\epsilon }_{D}\) at peak).
In order to integrate the 3D model, the critical cumulative plastic deformation is calculated using \({p}_{R}\text{=}{\left(\frac{2}{3}{\epsilon }_{R}\mathrm{:}{\epsilon }_{R}\right)}^{1/2}\) taking into account that the uniaxial state is defined by a one-dimensional state under stress but three-dimensional in deformation [bib5] _:
\({\epsilon }_{R}\text{=}\left[\begin{array}{ccc}{\epsilon }_{R}& 0& 0\\ 0& \text{-}{\nu }^{\text{*}}{\epsilon }_{R}& 0\\ 0& 0& \text{-}{\nu }^{\text{*}}{\epsilon }_{R}\end{array}\right]\) eq 3.2-4
where \({\nu }^{\text{*}}\) is the contraction coefficient, equal to the Poisson’s ratio \(\mathrm{\nu }\) in elasticity:
\({\nu }^{\text{*}}\text{=}\nu \frac{{\varepsilon }^{e}}{\varepsilon }\text{+}\frac{1}{2}\frac{{\varepsilon }^{p}}{\varepsilon }\text{=}\frac{1}{2}\text{-}\frac{{\varepsilon }^{e}}{\varepsilon }(\frac{1}{2}\text{-}\nu )\) eq 3.2-5
here \(\epsilon \text{=}{\epsilon }_{R}\) and we approximate \({\mathrm{\varepsilon }}^{e}\) by: \({\varepsilon }_{y}\text{=}\frac{{\sigma }_{y}}{E}\)
\({\nu }^{\text{*}}\text{=}\frac{1}{2}\text{-}\frac{{\varepsilon }_{y}}{{\varepsilon }_{R}}(\frac{1}{2}\text{-}\nu )\) eq 3.2-6
For the calculation of \({p}_{D}\), it is considered that the triaxiality rate at the damage threshold is identical to that at breakage:
\({p}_{D}\text{=}\text{0,8}{p}_{R}\) eq 3.2-7

