3. B modeling#
3.1. Characteristics of B modeling#
It is the same modeling as for modeling A, but selectively: AXIS_HHS.
3.2. Tested sizes and results#
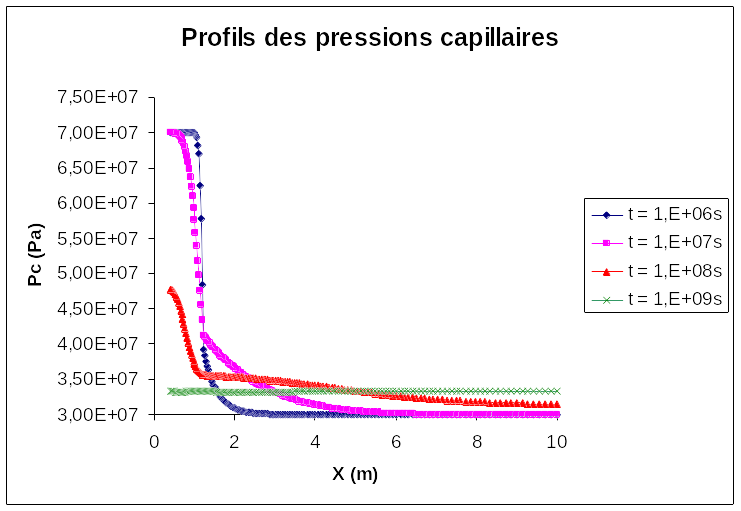
This test case does not present a reference solution (it comes from a storage benchmark), so we present capillary pressure profiles in accordance with what can be physically expected for such simulations.
Tested values:
Node Number |
Coordinate |
\(\mathit{PRE1}\) \(t\mathrm{=}\mathrm{1,E+06}s\) |
\(t\mathrm{=}\mathrm{1,E+07}s\) |
\(t\mathrm{=}\mathrm{1,E+08}s\) |
\(t\mathrm{=}\mathrm{1,E+09}s\) |
|
294 |
1,285 |
3,674E+07 |
4,082E+07 |
3,561E+07 |
3,326E+07 |
3,326E+07 |
309 |
1,118 |
6,697E+07 |
4,986E+07 |
3,609E+07 |
3,327E+07 |
3,327E+07 |