3. Modeling A#
3.1. Characteristics of modeling A#
Modeling in 2D plane deformations.
Hydraulic law: “LIQU_AD_GAZ_VAPE”
50 \(Q8\) items.
The simulation is carried out over one year.
3.2. Result of modeling A#
The following figures show the profiles of variation in temperature, capillary pressure, pressure, saturation and gas pressure variation (with respect to the initial state) at various times (1 hour, 1 month, 1 year). The observed behavior corresponds well to that of drying with a progressive desaturation front. The kinetics are logically different for thermal and for drying. This is a case of non-regression (no reference solution).
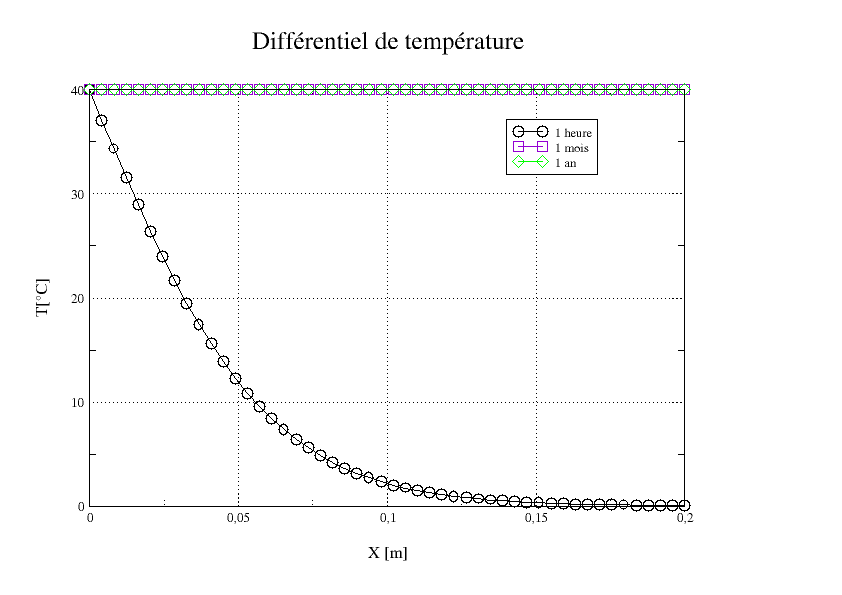
Figure 3.2-1: Temperature profiles
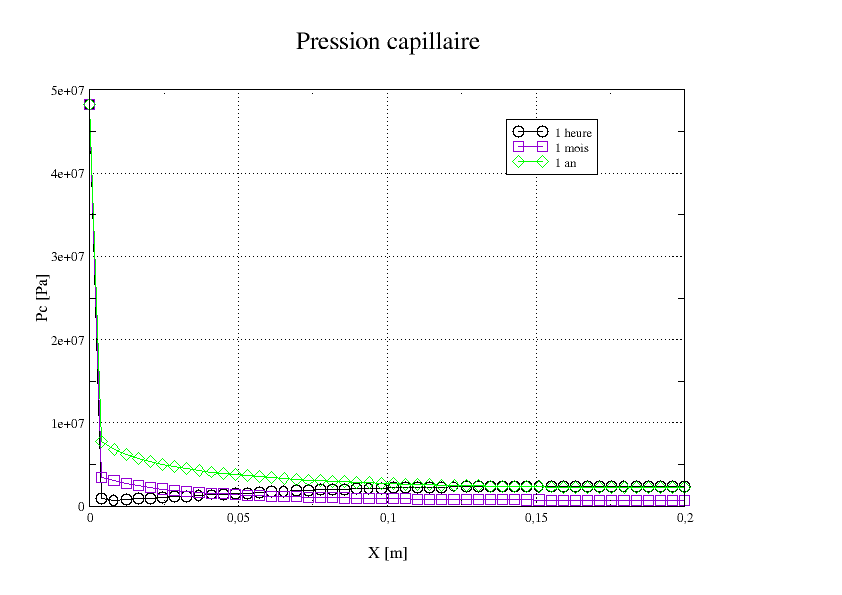
Figure 3.2-2: Capillary Pressure Profiles
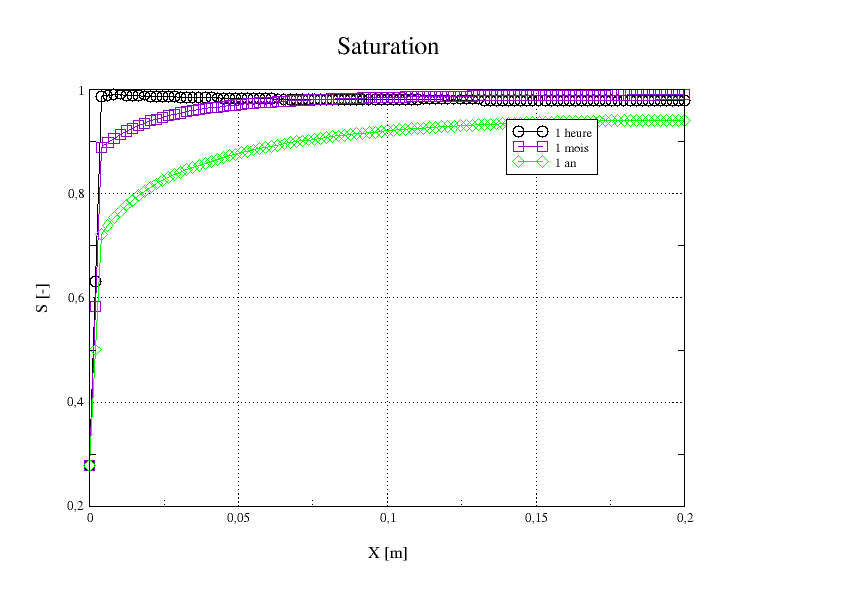
Figure 3.2-3: Saturation profiles
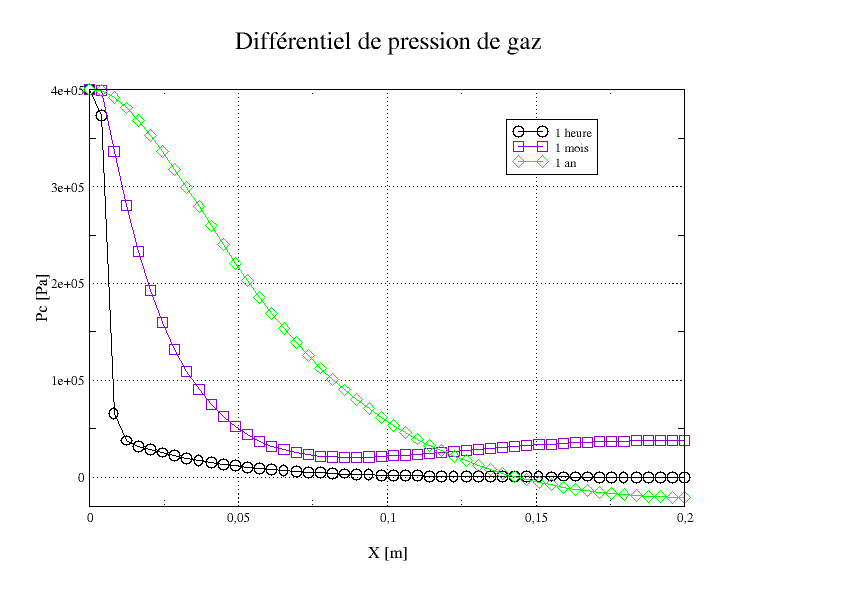
Figure 1: Gas pressure profiles
The pressure and saturation values are checked at node 14 (x=0.04; y=0).
Time |
S |
PRE1 (MPa) |
1 hour |
0.984 |
1, 35 |
1 month |
0.965 |
1, 57 |
1 year |
0, 862 |
4, 11 |
It is then verified on a 1-hour model that the isotherm is well taken into account in order to:
the law of behavior “LIQU_AD_GAZ”.
Time |
PRE1 (MP a) |
1 hour |
1, 29 |
the law of behavior “LIQU_GAZ”.
Time |
PRE1 (MP a) |
1 hour |
1, 29 |
the law of behavior “LIQU_VAPE_GAZ”.
Time |
PRE1 (MP a) |
1 hour |
1, 33 |