3. Modeling A#
3.1. Characteristics of modeling#
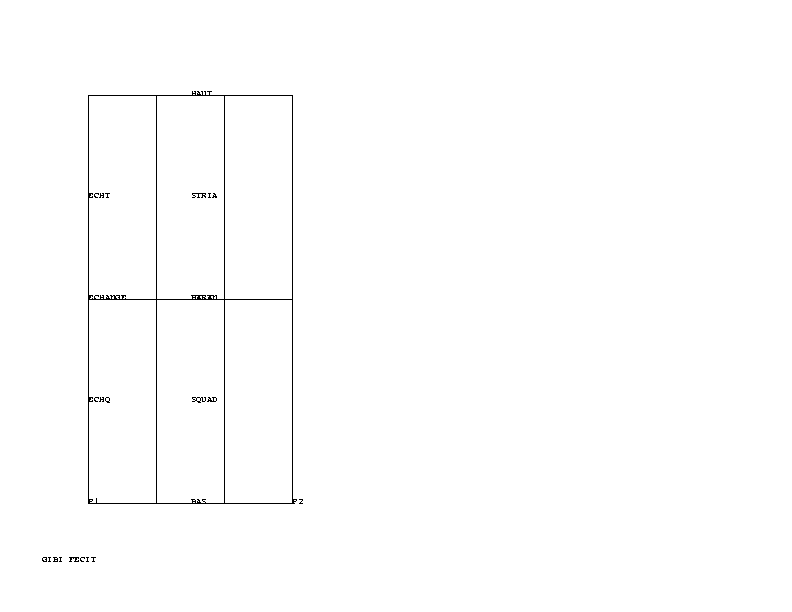
Modeling A corresponds to the TP statement. It only includes the first thermal calculation (without diagonalization of the thermal mass). The mesh has 3 QUAD4 meshes in the thickness (mesh GIBI).
3.2. Characteristics of the mesh#
6 meshes
The useful edges for boundary conditions are defined by the cell groups:
\(\mathit{ECHANGE}\) (left edge)
\(\mathit{HAUT}\) (top edge)
\(\mathit{BAS}\) (bottom edge)
3.3. Tested sizes and results#
Temperature |
instant |
Identification |
Reference |
Aster |
% difference |
maximum |
4 |
Temp max |
126.314 |
126.314 |
0 |
Note:
This modeling only includes a non-regression test. It is the starting point of the TP, intended to improve modeling (cf modeling B) . On the evolution of the temperature in the middle of the cylinder as a function of time, and the temperature distribution at \(t\mathrm{=}\mathrm{4s}\). We note (see red curves, with square marker in the following figure) that we exceed the temperature of \(100°C\) , which is not a physical step. This characterizes a lack of respect for the principle of maximum.