6. Summary of results#
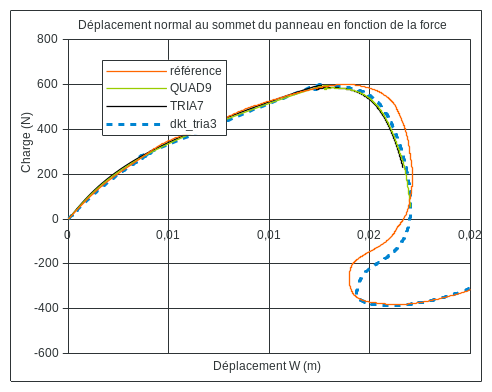
Figure 7-a: Normal movement at the top of the panel as a function of the force apply. Magnification around limit point 1

Figure 7-b: Normal movement at the top of the panel as a function of the force applynormalized by its maximum value (DKT TRIA3 in purple)
The modeling results COQUE_3D for the two limit loads 1 and 4 are correct. The maximum error is 2.5% for mesh TRIA7 and 2.8% for mesh QUAD9. On the other hand, the error in vertical displacement is more significant. It is 5.6% for mesh TRIA7 and 5.9% for mesh QUAD9.
The results between the two limit loads 1 and 4 are qualitatively correct. Endpoints 2 and 3 are well detected. Quantitatively, the values of the movements for these points are good at less than 1% for the limit point 2 and at less than 5% for the limit point 3. In terms of the corresponding loads, the load at limit point 2 is very greatly underestimated (of the order of 70%) and that at limit point 3 is greatly overestimated (of the order of 20%).
Regardless of the mesh, the pre-buckling behavior is correctly evaluated. The post-buckling pace makes it possible to correctly determine the movements at limit points 2 and 3. The charges obtained are further away from the reference solution. From limit point 4, we find a good agreement between the reference and our solution.
The transverse shear correction coefficient A_ CIS was set to \(0.833\), corresponding to thick shells. The value (\(2500={10}^{6}\times H/L\)) that should have been taken into account does not allow the calculations to be carried out, due to poor conditioning of the stiffness matrices.
The same results are found with modeling DKT (mesh TRIA3) as with modeling COQUE_3D.
We also test the same calculation with modeling DKTpour the QUAD4 cells. However, it converges poorly because of its poor description for the shell (curved).