7. Summary of results#
The following figures show the evolution of the various quantities during the tensile test with Rankine’s law.
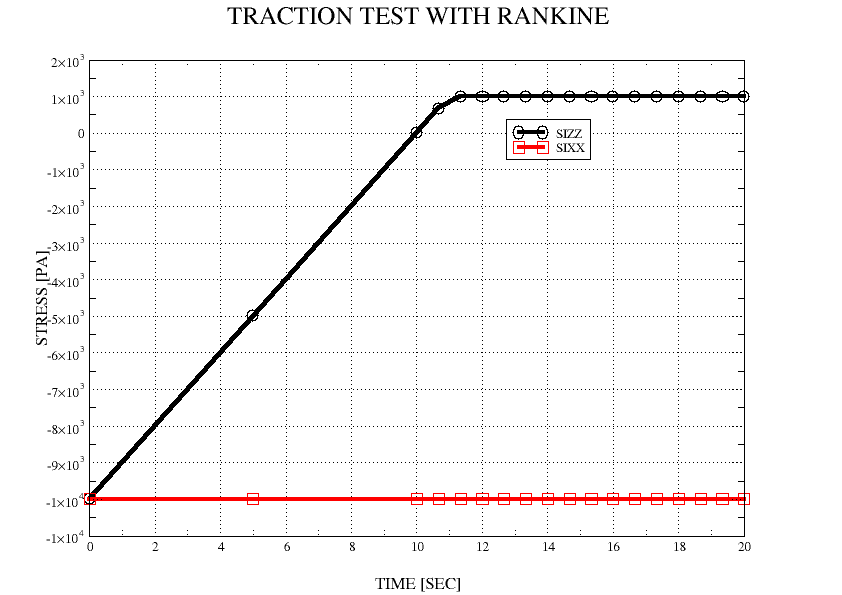
Figure 1: Evolution of the stresses during the tensile test
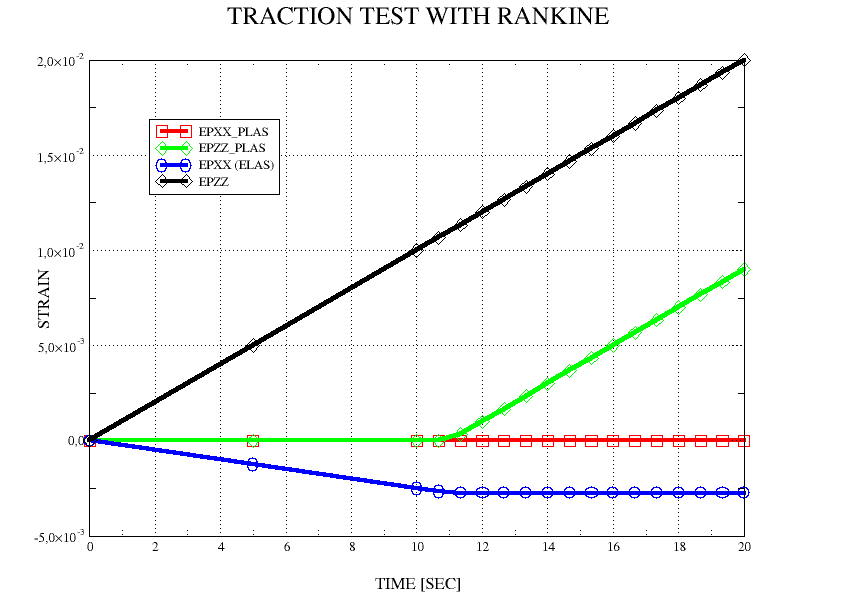
Figure 2: Evolution of deformations during the traction test
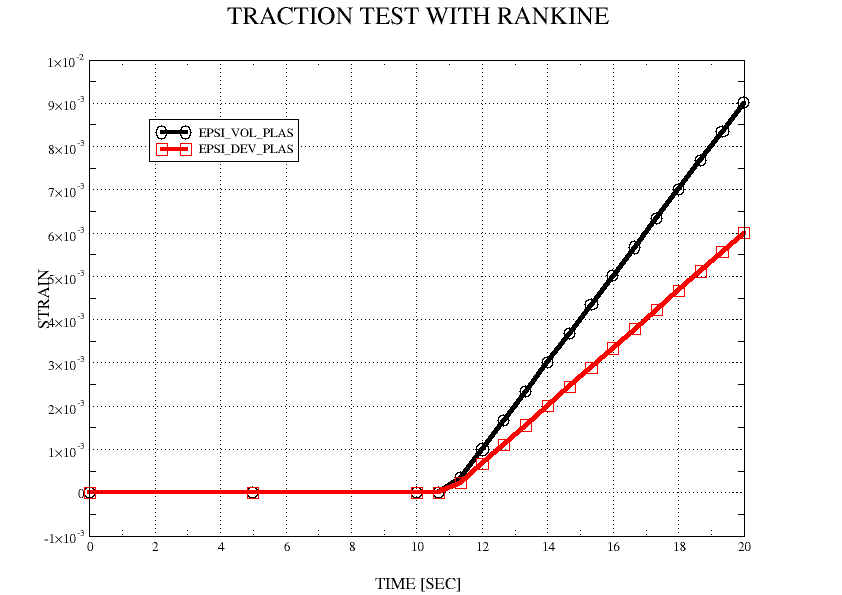
Figure 3: Evolution of the internal variables during the traction test