2. Benchmark solution#
2.1. Calculation method used for the reference solution#
Finite element calculation with ADINA. Update the tangent stiffness matrix using the BFGS method (BROYDEN, FLETCHER, GOLDFARB and SHAMNO). Calculation of \(J\) by Rice integral in which the deformation energy density is evaluated according to Hencky’s plasticity theory (nonlinear reversible elastic model equivalent to the incremental plasticity theory for increasing monotonic radial loading in the space of principal stresses)
2.2. Benchmark results#
Load/travel response curve

Response curve giving the load \(P/1000\) as a function of the displacement \(d/20\). Upper curve calculated in plane deformations, lower curve calculated in plane stresses. Interspersed curves are experimental results. Reference stress \({\sigma }_{\mathrm{ref}}=\mathrm{334,6}\mathrm{MPa}\) (first point on the tension curve). Test specimen thickness \(B=\mathrm{6,36}\) or \(\mathrm{6,39}\mathrm{mm}\). Crack length \(a/W=\mathrm{0,5}\).
Integral J as a function of the load
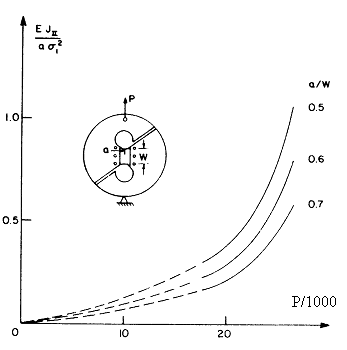
Normalized integral \(E\mathrm{\times }{J}_{\mathit{II}}\mathrm{/}(a\mathrm{\times }{\sigma }_{\mathit{ref}}^{2})\) as a function of the stress \(P\mathrm{/}1000\), where \({\sigma }_{\mathit{ref}}\mathrm{=}\mathrm{334,6}\mathit{MPa}\), for a specimen of thickness \(B\mathrm{=}\mathrm{6,44}\mathit{mm}\)
Some tabulated values are also available, for a crack length \(a\mathrm{/}W\mathrm{=}\mathrm{0,5}\) and a calculation using plane deformations; the dispersion of \({J}_{\mathit{II}}\) is linked to the choice of the integration contour around the crack bottom.
No loading |
\(P(\mathit{KN})\) |
|
22 |
27.66 |
0.292 to 0.295 |
36 |
35.11 |
0.540 to 0.543 |
50 |
38.83 |
0.798 to 0.813 |
64 |
41.49 |
1.065 to 1.190 |
2.3. Uncertainty about the solution#
The difference between experimental measurements and calculation does not exceed step \(\text{7\%}\), as far as the load/displacement response curve is concerned.
The accuracy of the calculation of \(J\) is unknown; the error seems to increase with the load level, as shown by the increasing dependence of \(J\) on the contour, which reaches a margin of variation of 12% in step 64.
2.4. Bibliographical references#
LESLIE BANKS - SILLS and DOV SHERMAN: Elasto-plastic analysis of a mode II fracture specimen. Int.J.Fracture, 46, 105-122, 1993.