3. Modeling A#
3.1. Characteristics of modeling#
We use a D_ PLAN modeling.
3.2. Characteristics of the mesh#
The mesh contains:
276 SEG2
3672 QUAD4
3.3. Tested sizes and results#
Normal contact and tangential frictional forces are tested.
Normal forces:
Identification ( “INST” )) ** |
Reference type |
Reference value |
Tolerance |
5.00000E-01 |
“NON_REGRESSION” |
-9.453879E+07 |
2.0E -05% |
6.00000E-01 |
“NON_REGRESSION” |
-1.345568E+08 |
2.0E -04% |
7.00000E-01 |
“NON_REGRESSION” |
-1.784029E+08 |
6.0E -05% |
8.00000E-01 |
“NON_REGRESSION” |
-2.255709+08 |
2.0E -04% |
9.00000E-01 |
“NON_REGRESSION” |
-2.755546E+08 |
2.0E -04% |
1.00000E+00 |
“NON_REGRESSION” |
-3.298982E+08 |
3.0E -05% |
1.00200E+00 |
“NON_REGRESSION” |
-3.324050E+08 |
3.0E -05% |
1.00400E+00 |
“NON_REGRESSION” |
-3.348981E+08 |
5.0E -05% |
1.00600E+00 |
“NON_REGRESSION” |
-3.373779E+08 |
2.0E -04% |
1.00800E+00 |
“NON_REGRESSION” |
-3.398438E+08 |
2.0E -04% |
1.01000E+00 |
“NON_REGRESSION” |
-3.422963E+08 |
2.0E -04% |
Tangential forces:
Identification ( “INST” )) ** |
Reference type |
Reference value |
Tolerance |
|
5.00000E-01 |
“NON_REGRESSION” |
1.835915E+07 |
3.0E -05% |
|
6.00000E-01 |
“NON_REGRESSION” |
2.667997E+07 |
2.0E -04% |
|
7.00000E-01 |
“NON_REGRESSION” |
3.598949E+07 |
5.0E -05% |
|
8.00000E-01 |
“NON_REGRESSION” |
4.608191E+07 |
5.0E -05% |
|
9.00000E-01 |
“NON_REGRESSION” |
5.688549E+07 |
5.5E -05% |
|
1.00000E+00 |
“NON_REGRESSION” |
6.902044E+07 |
6.0E -05% |
|
1.00200E+00 |
“NON_REGRESSION” |
7.269331E+07 |
4.0E -05% |
|
1.00400E+00 |
“NON_REGRESSION” |
7.637172E+07 |
1.0E -05% |
|
1.00600E+00 |
“NON_REGRESSION” |
8.005592E+07 |
1.0E -05% |
|
1.00800E+00 |
“NON_REGRESSION” |
“” |
8.374614E+07 |
3.0E -05% |
1.01000E+00 |
“NON_REGRESSION” |
“” |
8.744260E+07 |
3.0E -05% |
In addition, if we compare the curves obtained with those in the literature, we obtain the graph in the figure.
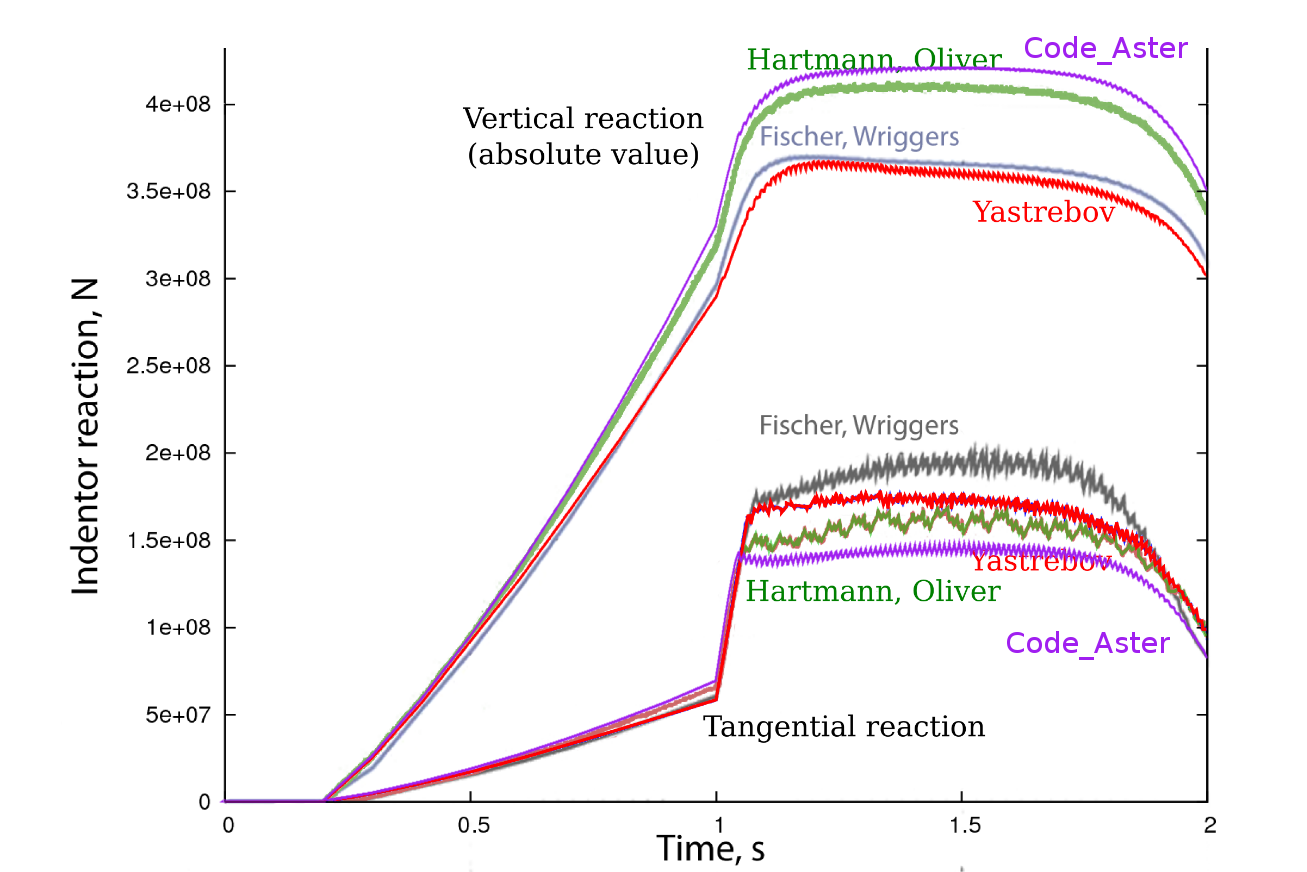
Figure 2: Comparing the results of different teams (image originally from [1])