3. Modeling A#
This modeling tests triangular elements with VMIS_ISOT_LINE. The loading in the elastic zone is done in several steps of time in order to test the convergence of the IMPLEX method in a single iteration.
3.1. Characteristics of modeling#
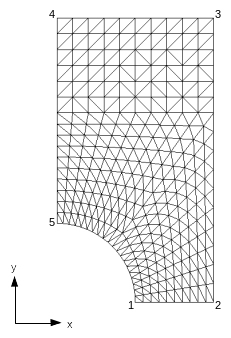
Figure 3.1-a : Model A mesh
Modeling: D_ PLAN
Boundary conditions:
\(\mathrm{DX}=0.0\mathrm{mm}\) out of \(45\),
\(\mathrm{DY}=0.0\mathrm{mm}\) out of \(12\),
\(\mathrm{DY}=0.3\mathrm{mm}\) out of \(34\).
3.2. Characteristics of the mesh#
The number of knots is 297. The mesh consists of linear triangular elements:
SEG2: 92
TRIA3: 520
3.3. Tested sizes and results#
Figure 3.4-1 shows the force-displacement curves calculated with both methods. The values tested are differences in effort between the two methods at different times.
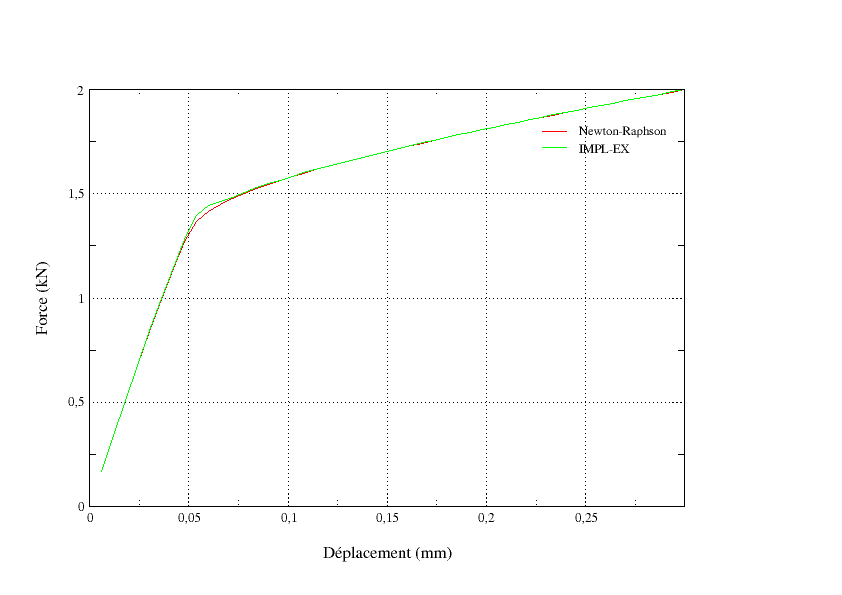
Figure 3.3-a : Force-displacement curves
Instant (s) |
Difference between the two curves ( \(\mathrm{kN}\) ) |
0.04 |
0 |
0.08 |
-5.65E-004 |
0.12 |
-5.00E-003 |
0.16 |
-8.95E-003 |
0.2 |
-2.94E-002 |
0.32 |
-1.26E-003 |
0.4 |
-5.63E-004 |
0.6 |
-1.60E-004 |
0.8 |
-9.43E-005 |
1 |
-8.69E-005 |
These values are tested in non-regression.
A least square criterion between the two curves is also used. Its value is: \(\mathrm{0,0824}\).