10. J modeling#
10.1. Characteristics of modeling#
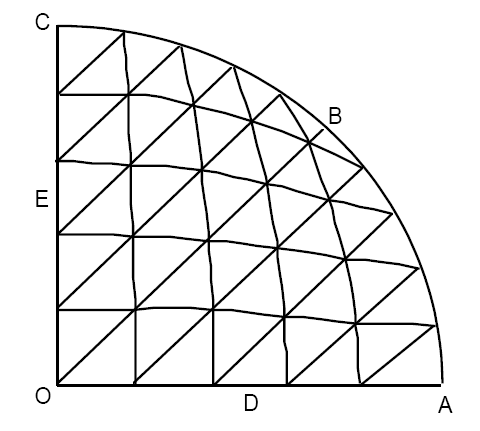
Modeling: Element of COQUE_3DMEC3TR7H
10.1.1. Boundary conditions#
at all the nodes of the arc \(\mathrm{ABC}\) |
DX:0., DY: 0. , DZ: 0. DRX :0., DRY :0. , DRZ :0. |
segment \(\text{]OA]}\) |
DY:0., DRX :0. , DRZ :0. |
segment \(\text{]OC]}\) |
DX:0., DRY :0. , DRZ :0. |
at node \(O\) |
DX:0., DY:0., DRX :0. , DRY :0. , DRZ :0. |
Node names:
Point \(0\) |
stitches: \(\mathrm{M1}\) and \(\mathrm{M2}\) |
Point \(A\) |
stitches: \(\mathrm{M41}\) |
Point \(B\) |
stitches: \(\mathrm{M49}\) and \(\mathrm{M50}\) |
Point \(C\) |
stitches: \(\mathrm{M10}\) |
Point \(D\) |
stitches: \(\mathrm{M21}\) |
Dot \(E\) |
stitches: \(\mathrm{M6}\) |
10.2. Characteristics of the mesh#
Number of knots: 121
Number of meshes and types: 50 TRIA7
10.3. Tested sizes and results#
Identification |
Reference type |
Reference values
|
Tolerance |
O |
“ANALYTIQUE” |
—703.40 |
0.5% |
A |
“ANALYTIQUE” |
10-10 |
|
B |
“ANALYTIQUE” |
10-10 |
|
C |
“ANALYTIQUE” |
10-10 |
|
D |
“ANALYTIQUE” |
—495.56 |
0.5% |
E |
“ANALYTIQUE” |
—495.56 |
0.5% |
Identification |
Reference type |
Reference values |
Tolerance |
|
O |
“ANALYTIQUE” |
—0.20625 |
1.3% |
|
“ANALYTIQUE” |
—0.20625 |
1.3% |
||
A |
“ANALYTIQUE” |
0.002 |
||
“ANALYTIQUE” |
—0.0875 |
1.5% |
||
C |
“ANALYTIQUE” |
—0.0875 |
2.3% |
|
“ANALYTIQUE” |
0.002 |
|||
D |
“ANALYTIQUE” |
—0.15469 |
1% |
|
“ANALYTIQUE” |
—0.17656 |
1% |
||
E |
“ANALYTIQUE” |
—0.15469 |
1% |
|
“ANALYTIQUE” |
—0.17656 |
1% |
||
10.4. notes#
The values are tested automatically using the functionalities offered by procedure POST_RELEVE:
extraction on the nodes corresponding to the observed points of the mean values of the components \({M}_{\mathit{xx}}\) and \({M}_{\mathit{yy}}\); these values are extracted from the field “EFGE_ELNO”, and the average is calculated for all the values available on the cells that contain the observed node,
calculation of the deviation from the reference value provided by applying the correspondence rules between \({M}_{\mathit{xx}}\), \({M}_{\mathit{yy}}\) and \({M}_{\mathit{rr}}\), \({M}_{\theta \theta }\) data on page 3.