3. Modeling A#
3.1. Characteristics of modeling#
In this modeling, the mesh method is tested for crack propagation. Level-sets are determined by orthogonal projection onto the segments making up the crack.
3.2. Characteristics of the mesh#
The structure is modelled by a regular mesh composed of \(90\times 30\) QUAD4, respectively along the axes \(x\), \(y\). The crack is not meshed.
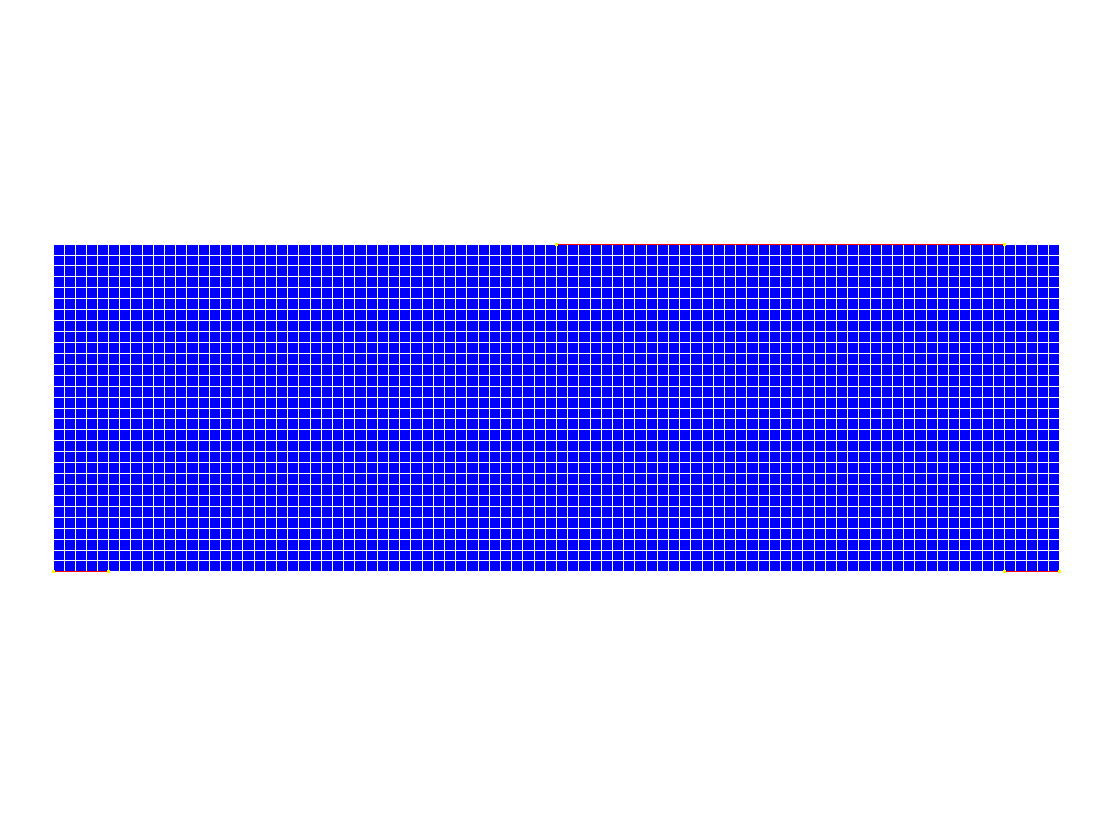
Figure 3.2-a : mesh of the cracked plate
3.3. Tested sizes and results#
For each propagation step, we test the value of the stress intensity factors \({K}_{I}\) and \({K}_{\mathrm{II}}\) given by CALC_G.
3.3.1. Results on \({K}_{I}\):#
A relative non-regression test is carried out on \({K}_{I}\) with an accuracy of \({2.10}^{-3}\).
3.3.2. Results on \({K}_{\mathrm{II}}\):#
For this test, we want \({K}_{\mathrm{II}}\) to be as \({K}_{\mathrm{II}}={K}_{\mathrm{IIref}}\pm {10}^{-2}\).
Identification |
Code_Aster |
Reference |
Difference |
CALC_G |
|||
KII_1 |
4,27722 10-2 |
4,27722 10-2 |
|
KII_2 |
1.21013 10-4 |
1.21013 10-4 |
|
KII_3 |
7,10255 10-3 |
7,10255 10-3 |
|
KII_4 |
1.94683 10-3 |
1.94683 10-3 |
|
KII_5 |
1.20266 10-3 |
1.20266 10-3 |
|
KII_6 |
8,82542 10-4 |
8,82542 10-4 |
|
KII_7 |
-1,23199 10-3 |
-1,23199 10-3 |
|
KII_8 |
-3,54655 10-3 |
-3,54655 10-3 |
|
KII_9 |
-4.54122 10-3 |
-4.54122 10-3 |
|
KII_10 |
-8,18030 10-3 |
-8,18030 10-3 |
|
KII_11 |
-1.55772 10-2 |
-1.55772 10-2 |
|
KII_12 |
-2,31849 10-2 |
-2,31849 10-2 |
|
KII_13 |
-3,52229 10-2 |
-3,52229 10-2 |
3.4. Additional results#
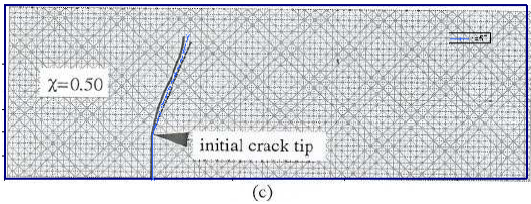
Figure 3.4-a : Comparison of the path obtained with the mesh method to the paths of the study by Mariani and Perego
On this, we can see: in black the numerical results of Mariani and Perego, in dotted lines the experimental results and in blue the results of the Code_Aster mesh method. The mesh method gives results similar to the experimental data.