3. Modeling A#
3.1. Characteristics of modeling#
In this modeling, the mesh method is tested for crack propagation. Level-sets are determined by orthogonal projection onto the segments making up the crack.
3.2. Characteristics of the mesh#
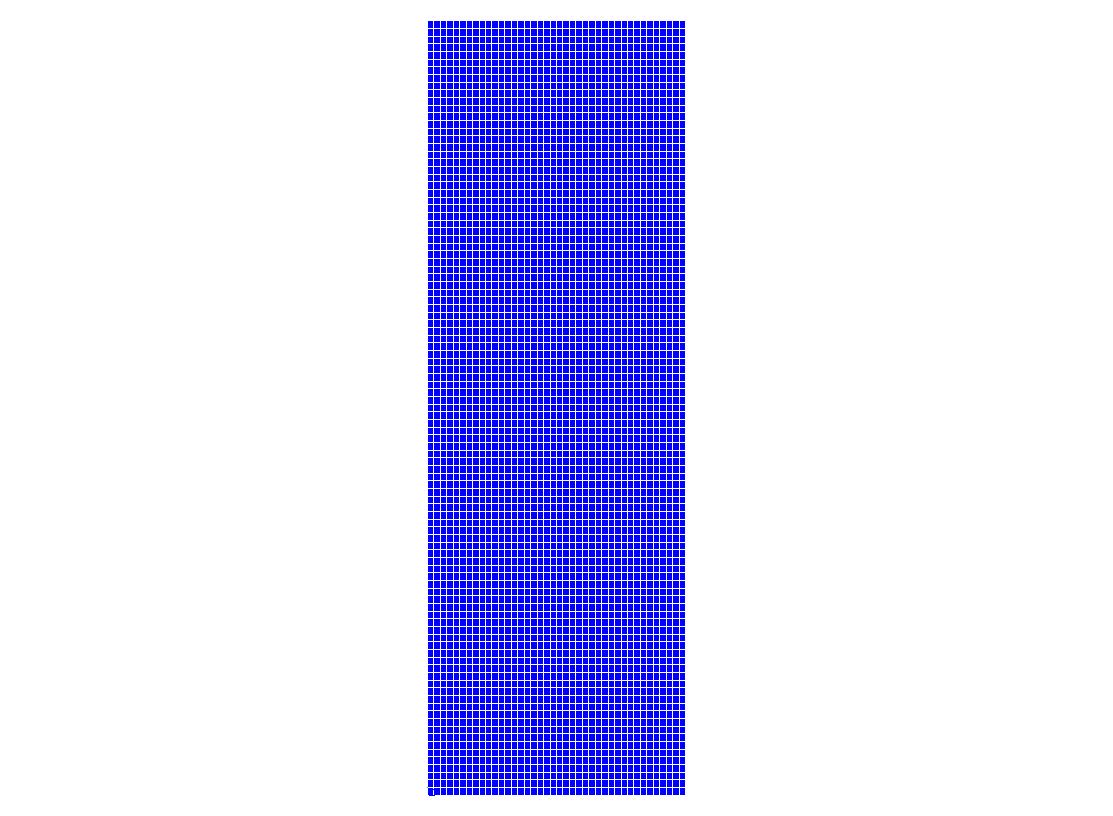
The structure is modelled by a regular « healthy » mesh composed of \(40\times 101\) QUAD4, respectively along the \(x,y\) axes. The crack is represented by a succession of SEG2, regardless of the mesh of the structure.

Figure 3.2-a : mesh of the cracked plate
3.3. Tested sizes and results#
For each propagation step (\(\mathrm{2,5}m\)), we test the value of the stress intensity factors \({K}_{I}\) and \({K}_{\mathrm{II}}\) given by CALC_G.
We also test the ordinate of the bottom of the crack given by PROPA_FISS.
3.3.1. Results on \({K}_{I}\):#
3.3.2. Results on \({K}_{\mathrm{II}}\):#
For this test, we want \({K}_{\mathrm{II}}\) to be less than \({10}^{-4}{K}_{I}\). So, we make sure that \({K}_{\mathrm{II}}\) is fairly close to zero, the reference value.
Identification |
Code_Aster |
Reference |
CALC_G |
||
KII_1 |
-2,7313 102 |
0 |
KII_2 |
-8,5062 101 |
0 |
KII_3 |
-2,6061 102 |
0 |
KII_4 |
1,5995 102 |
0 |
KII_5 |
-2,7309 102 |
0 |
KII_6 |
-2,3176 102 |
0 |
KII_7 |
-3,1276 102 |
0 |
KII_8 |
3,1327 102 |
0 |
KII_9 |
-3,8393 102 |
0 |
KII_10 |
-4,1916 102 |
0 |
KII_11 |
-4,986 102 |
0 |
KII_12 |
-5,6998 102 |
0 |
KII_13 |
-6,7642 102 |
0 |
KII_14 |
-7,9542 102 |
0 |
KII_15 |
-9,5344 102 |
0 |
3.3.3. Results on the ordinate of the bottom of the crack:#
It is verified that the ordinate coordinates of the successive crack bottoms are close to the initial value. This check gives the same information as the test on \({K}_{\mathrm{II}}\).
Identification |
Code_Aster |
Reference |
Difference |
|
CALC_G |
||||
y_1 |
15 |
15 |
15 |
0% |
y_2 |
15 |
15 |
15 |
2.18 10-4% |
y_3 |
15 |
15 |
15 |
2.8 10-4% |
y_4 |
15 |
15 |
15 |
4.51 10-4% |
y_5 |
15 |
15 |
15 |
5.47 10-4% |
y_6 |
15 |
15 |
15 |
6.95 10-4% |
y_7 |
15 |
15 |
15 |
8.1 10-4% |
y_8 |
15 |
15 |
15 |
9.5 10-4% |
y_9 |
15,0002 |
15 |
0.001% |
|
y_10 |
15,0002 |
15 |
0.001% |
|
y_11 |
15,0002 |
15 |
0.001% |
|
y_12 |
15,0002 |
15 |
0.002% |
|
y_13 |
15,0002 |
15 |
0.002% |
|
y_14 |
15,0003 |
15 |
0.002% |
|
y_15 |
15,0003 |
15 |
0.002% |
3.4. Additional results#

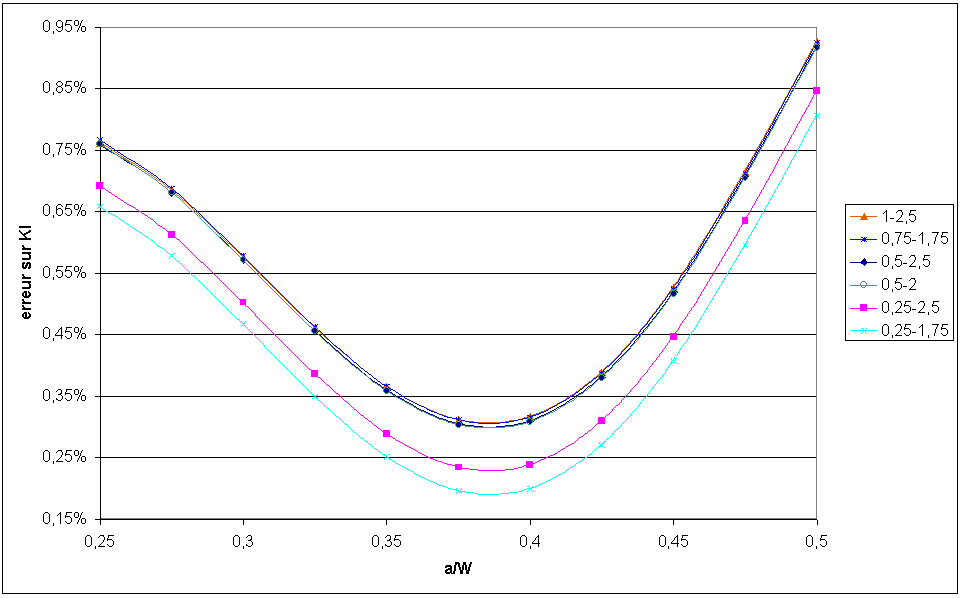
Figure 3.4-a : Influence of the choice of RI and RS crowns on the error on KI
Here we can see that the most suitable configuration for choosing \(\mathrm{RI}\) and \(\mathrm{RS}\) (lower and upper crowns of the theta field) is: \(\mathrm{RI}=2\ast {L}_{0}\) and \(\mathrm{RS}=7\ast {L}_{0}\) where \({L}_{0}\) is the smallest edge of the mesh.