4. B modeling#
4.1. Characteristics of modeling#
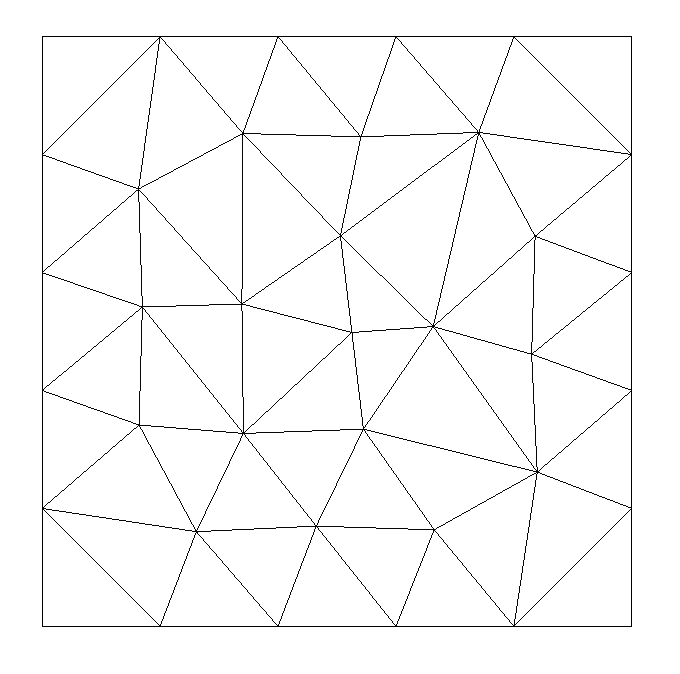
The plate consists of 54 meshes of TRIA3modélisés in DKT.
4.2. Comparisons and results#
4.2.1. Comparisons#
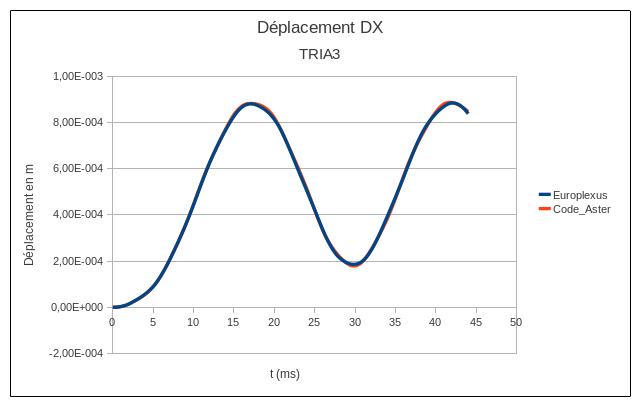
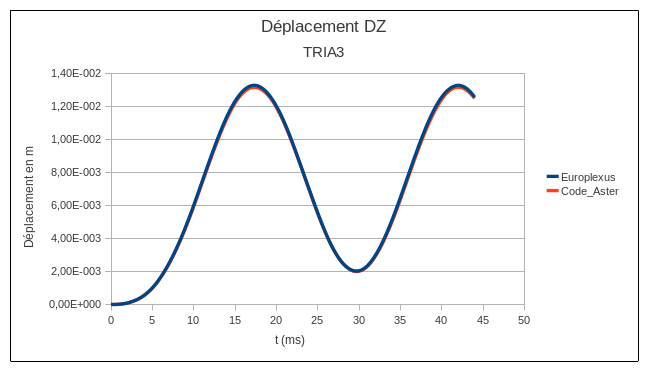
Comparisons are made on the components \(\mathit{DX}\), \(\mathit{DZ}\) and \(\mathit{DRY}\) of the displacement of the point \(\mathit{P2}\). Unlike modeling A, there is no comparison of constraints here, because Europlexus does not allow the calculation of constraints on several layers with triangular cells (T3GS modeling).
The following 3 figures compare the changes in these values over time for the two calculation codes.
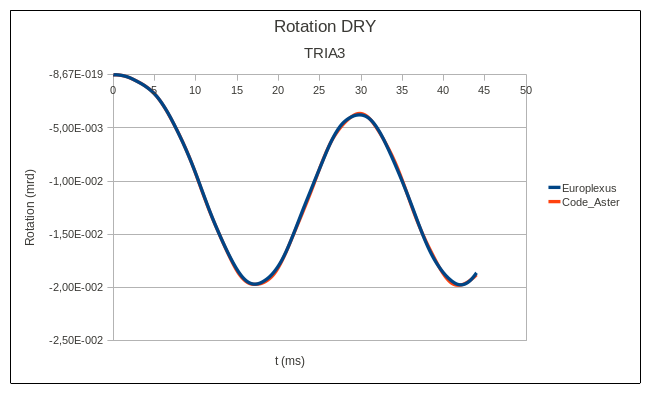
4.2.2. Tested results#
The results tested correspond to the values compared above to the second peak, i.e. for times around \(\mathrm{0,042}\mathit{ms}\) (the times are slightly different depending on the quantities).
Node |
Field |
Component |
Order |
Ref Value. (m) |
Precision |
Reference |
|
\(P3\) |
|
DX |
\(5214\) |
|
|
|
|
\(P3\) |
|
DZ |
\(5250\) |
|
|
|
|
\(P3\) |
|
|
|
|
|
|