2. Modeling A#
2.1. Crack path found#
The crack path found by the control is given in the. In the, the crack is superimposed on the field map.
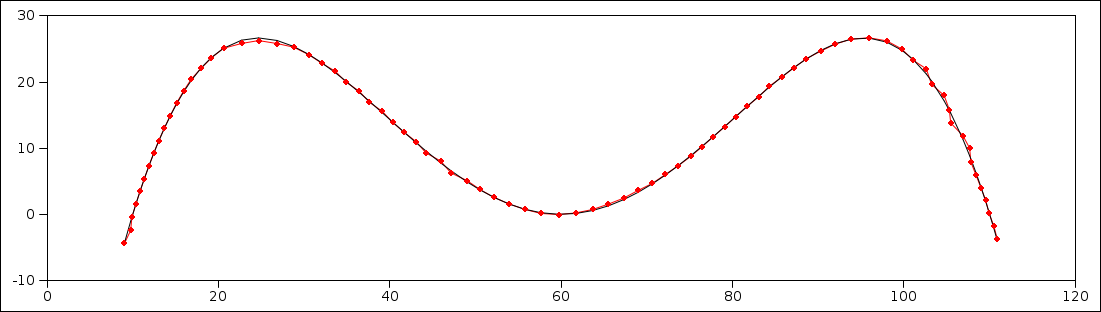
Figure 2.1-1 : Theoretical crack path (black) compared with that provided by the order.
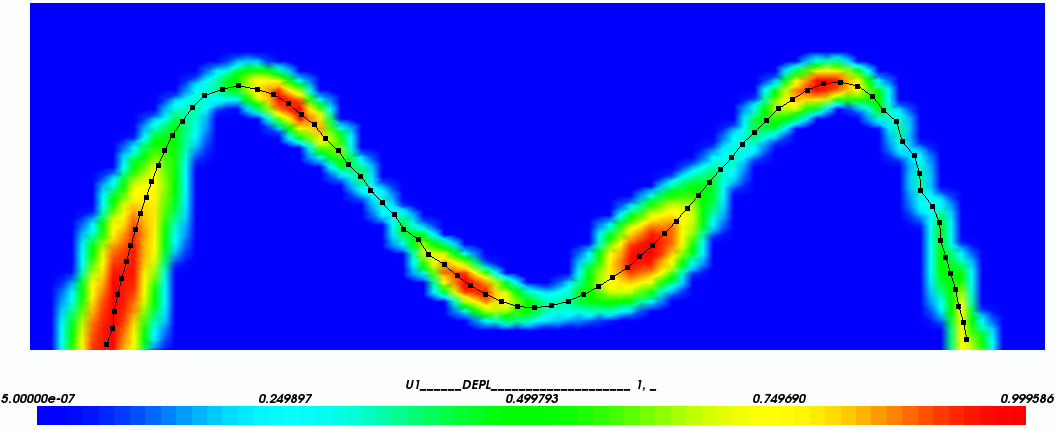
Figure 2.1-2 : crack path superimposed on the post-treated field.
2.2. Tested sizes and results#
We test the distance between the points found by the algorithm and the theoretical curve. This distance, stored in the test case command file in table TAB_FISS, represents the absolute error at each point. We then check that the maximum error is less than a certain precision. The test is done in absolute terms, because we compare ourselves to a zero distance. The required precision is 0.05, the test case is analytical.
2.3. notes#
The journey found is very satisfactory. The procedure well reproduces the strong curvatures of the path, as well as the variations in the value of the field.
The accuracy is related to the width of the damaged band, as seen on the right side of the: the error is greater where the width of the damaged band is cramped.
That said, normally the damage resulting from a mechanical calculation is extended over several elements, so that the convergence with respect to the refinement is verified, which limits this type of error.