2. Modeling A#
2.1. Characteristics of modeling#
D_ PLAN_HH2SUDA modeling. This modeling corresponds to Volume Finite Decentralized Edges modeling. Coupling LIQU_AD_GAZ.
2.2. Characteristics of the mesh#
A mesh consisting of 1632 TRIA7 elements is used.
2.3. Tested sizes and results#
The gas pressure and capillary pressure profiles are plotted at the bottom of the domain at various times:
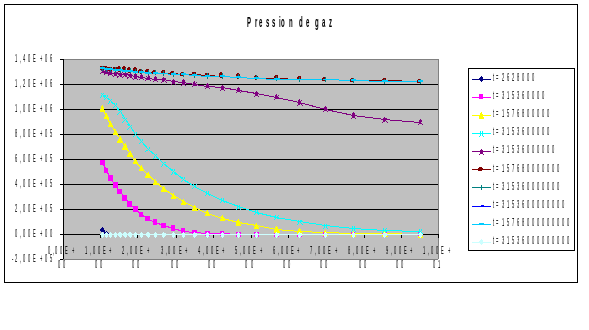
Figure 1: Gas Pressure Profiles, \(Y=0\)
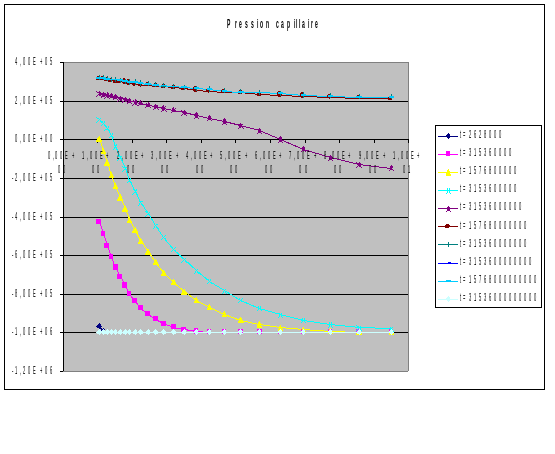
Figure 2: Capillary Pressure Profiles, \(Y=0\)
A gradual increase in gas pressure is observed first by dissolution (when the medium is saturated, i.e. when the capillary pressures are negative) and then in gaseous form as soon as desaturation begins after 50 years. The medium will then desaturate over its entire length. After the injection time, the medium is restored and the gas pressure decreases. These results are in line with those expected.
This test case has no reference value, so we make it a non-regression case.
Size |
Points \((x,y)\) |
Time \((s)\) |
Reference |
Tolerance |
PRE1 |
(1.02; 0.947) NT335 |
1 month |
-9.55974E+05 |
|
PRE1 |
(5.05; 5.25) NT551 |
1 month |
-9.99999E+05 |
|
PRE1 |
(9.86; 9.7) NT566 |
1 month |
-9.99999E+05 |
|
PRE2 |
(1.02; 0.947) NT335 |
1 month |
44025.7 |
|
PRE2 |
(5.05; 5.25) NT551 |
1 month |
1.63287E-13 |
|
PRE2 |
(9.86; 9.7) NT566 |
1 month |
3.477E-15 |
0.010 |
Table 2.3-1: Tested values