3. Modeling A#
3.1. Characteristics of modeling A#
The results presented here result from the modeling in plane deformations D_ PLAN_THHD carried out with 2988 elements TRI3.
3.2. Results#
Capillary pressure and saturation profiles are presented on a horizontal (\(y\mathrm{=}\mathrm{450m}\)) and vertical (\(x\mathrm{=}\mathrm{7m}\)) section.

Figure 3.3-a: Capillary Pressure Profiles \(Y\mathrm{=}\mathrm{-}\mathrm{450m}\)

Figure 3.3-b: Saturation Profiles \(Y\mathrm{=}\mathrm{-}\mathrm{450m}\)
Figure 3.3-c: Capillary Pressure Profiles \(X\mathrm{=}7m\)
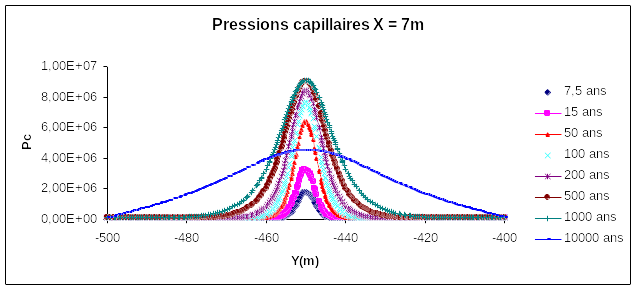
Figure 3.3-d: Saturation Profiles \(X\mathrm{=}7m\)
3.3. Tested sizes and results#
\(X\) ( \(m\) ) |
\(Y\) ( \(m\) ) |
Time (years) |
\(\mathrm{PRE1}\) ( \(\mathrm{Pa}\) )) External Source** |
Tolerance (:math:`text{%}`**) ** |
|
5 |
-450 |
27 |
27 |
2.9E7 |
20 |
5 |
-450 |
10000 |
10000 |
4.35E6 |
20 |
7 |
-450 |
27 |
3.6E6 |
20 |
|
7 |
-450 |
10000 |
10000 |
4.34E6 |
20 |
The results are qualitatively consistent with those found in the Alliances literature: we only have isovalues as a reference, so the error tolerance is quite high (\(\text{20\%}\)).