4. B modeling#
4.1. Characteristics of modeling#
This is a 3D_HM modeling using quadratic HM- XFEM elements.
4.2. Characteristics of the mesh#
The block on which the modeling is performed is divided into 49 QUAD8.
4.3. Tested sizes and results#
We test the value of the vertical movements for the nodes \(A\), \(A\text{'}\),,, \(B\) and \(B\text{'}\) which are located on the interface as well as the value of the pressure of the fluid in the interface at these 4 points. These values are summarized in the table below:
Quantities tested |
Reference type |
Reference value |
|
DY (node A below) |
“NON_REGRESSION” |
-1.291354325E-4 m |
|
DY (node A above) |
“NON_REGRESSION” |
1.29078868E-4 m |
|
DY (node A” below) |
“NON_REGRESSION” |
-1.290767537E-4 m |
-1.290767537E-4 m |
DY (node A” above) |
“NON_REGRESSION” |
1.291366642E-4 m |
|
DY (node B below) |
“NON_REGRESSION” |
-1.08739681E-4 m |
|
DY (node B above) |
“NON_REGRESSION” |
1.08687768E-4 m |
|
DY (node B” below) |
“NON_REGRESSION” |
-1.08735144E-4 m |
|
DY (node B” above) |
“NON_REGRESSION” |
1, E-4 m |
|
PRE_FL1 (node A) |
“NON_REGRESSION” |
822498Pa |
|
PRE_FL1 (node A”) |
“NON_REGRESSION” |
822565Pa |
|
PRE_FL1 (node B) |
“NON_REGRESSION” |
762613Pa |
|
PRE_FL1 (node B”) |
“NON_REGRESSION” |
762664Pa |
4.4. notes#
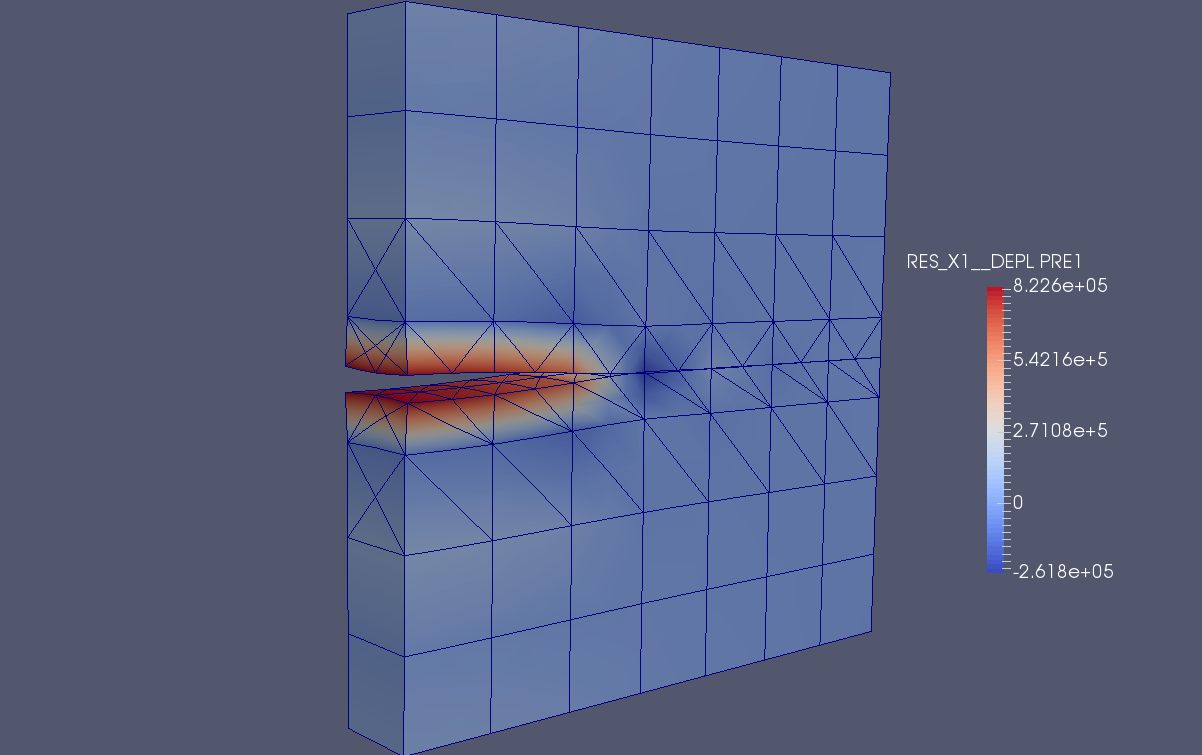
The pore pressure field and the amplified deformation (X1000) (Figure) were also post-treated using SALOME.
Figure 4.4-a : Field of pre**s** amplified pore and deformed (X1000)