7. E modeling#
7.1. Characteristics of modeling#
20 items POU_D_E
7.2. Characteristics of the mesh#
Number of knots: 21
Number of meshes and types: 20 SEG2 (10 in each branch)
7.3. Characteristics of the cross section mesh#
Number of fibers: 100 (10 on each side)
Number of meshes and types: 100 QUAD4
7.4. Tested sizes and results#
7.4.1. Tested values#
The values tested are taken from the table.
Effort (\(N\)) |
\(\mathit{DX}\) (\(\mathit{mm}\)) |
() |
\(\mathit{DZ}\) (\(\mathit{mm}\)) |
Tolerance/\(\mathit{DX}\) |
Tolerance/\(\mathit{DZ}\) |
1.0 |
1.9557493475982E-01 |
8.1849504440533E-01 |
4.0E-03 |
1.2E-02 |
|
1.2 |
2.2003159601578E+01 |
4.5085834614729E+01 |
2.3E-02 |
1.0E-02 |
1.0E-02 |
1.4 |
5.1370721240215E+01 |
5.9127605459760E+01 |
2.0E-02 |
1.5E-02 |
1.5E-02 |
1.6 |
7.2307885049332E+01 |
6.1008538728158E+01 |
1.5E-02 |
1.5E-02 |
1.5E-02 |
2.0 |
9.9971229134146E+01 |
5.5985405418044E+01 |
7.0E-03 |
2.0E-02 |
|
3.0 |
1.3415730437940E+02 |
3.9186532467172E+01 |
2.0E-03 |
1.7E-02 |
1.7E-02 |
4.0 |
1.5070726872507E+02 |
2.7659987903886E+01 |
5.5E-03 |
1.0E-02 |
|
5.0 |
1.6092765462757E+02 |
2.0199252710901E+01 |
1.0E-02 |
1.0E-02 |
1.0E-03 |
An arc-length technique is used to obtain the response of the structure, the calculation times cannot therefore be directly imposed. However, an effort is made to choose the values of the control state that are closest to the reference times.
7.4.2. Graphical results of modeling E#
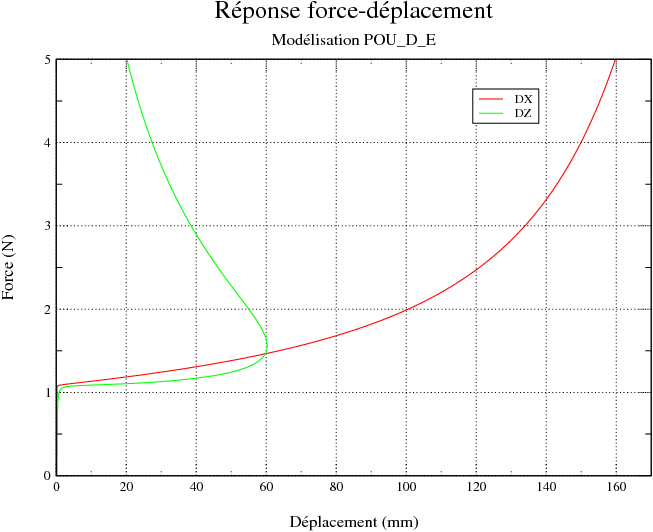
Figure 7.4.2-a : Force-Displacement Response, Modeling POU_D_E.
7.4.3. notes#
The relative differences with the results of modeling A taken as a reference are small. Contrary to modeling POU_D_TGM, we do not notice a decrease in the gap over time. The “GROT_GDEP” cutscene of the element POU_D_E is therefore very satisfactory.