3. Modeling A#
3.1. Characteristics of modeling#
20 items POU_D_T_GD
3.2. Characteristics of the mesh#
Number of knots: 21
Number of meshes and types: 20 SEG2 (10 in each branch)
3.3. Tested sizes and results#
For this modeling, the tests are non-regression. The values appear as references in all other models.
3.3.1. Graphical results of modeling A#
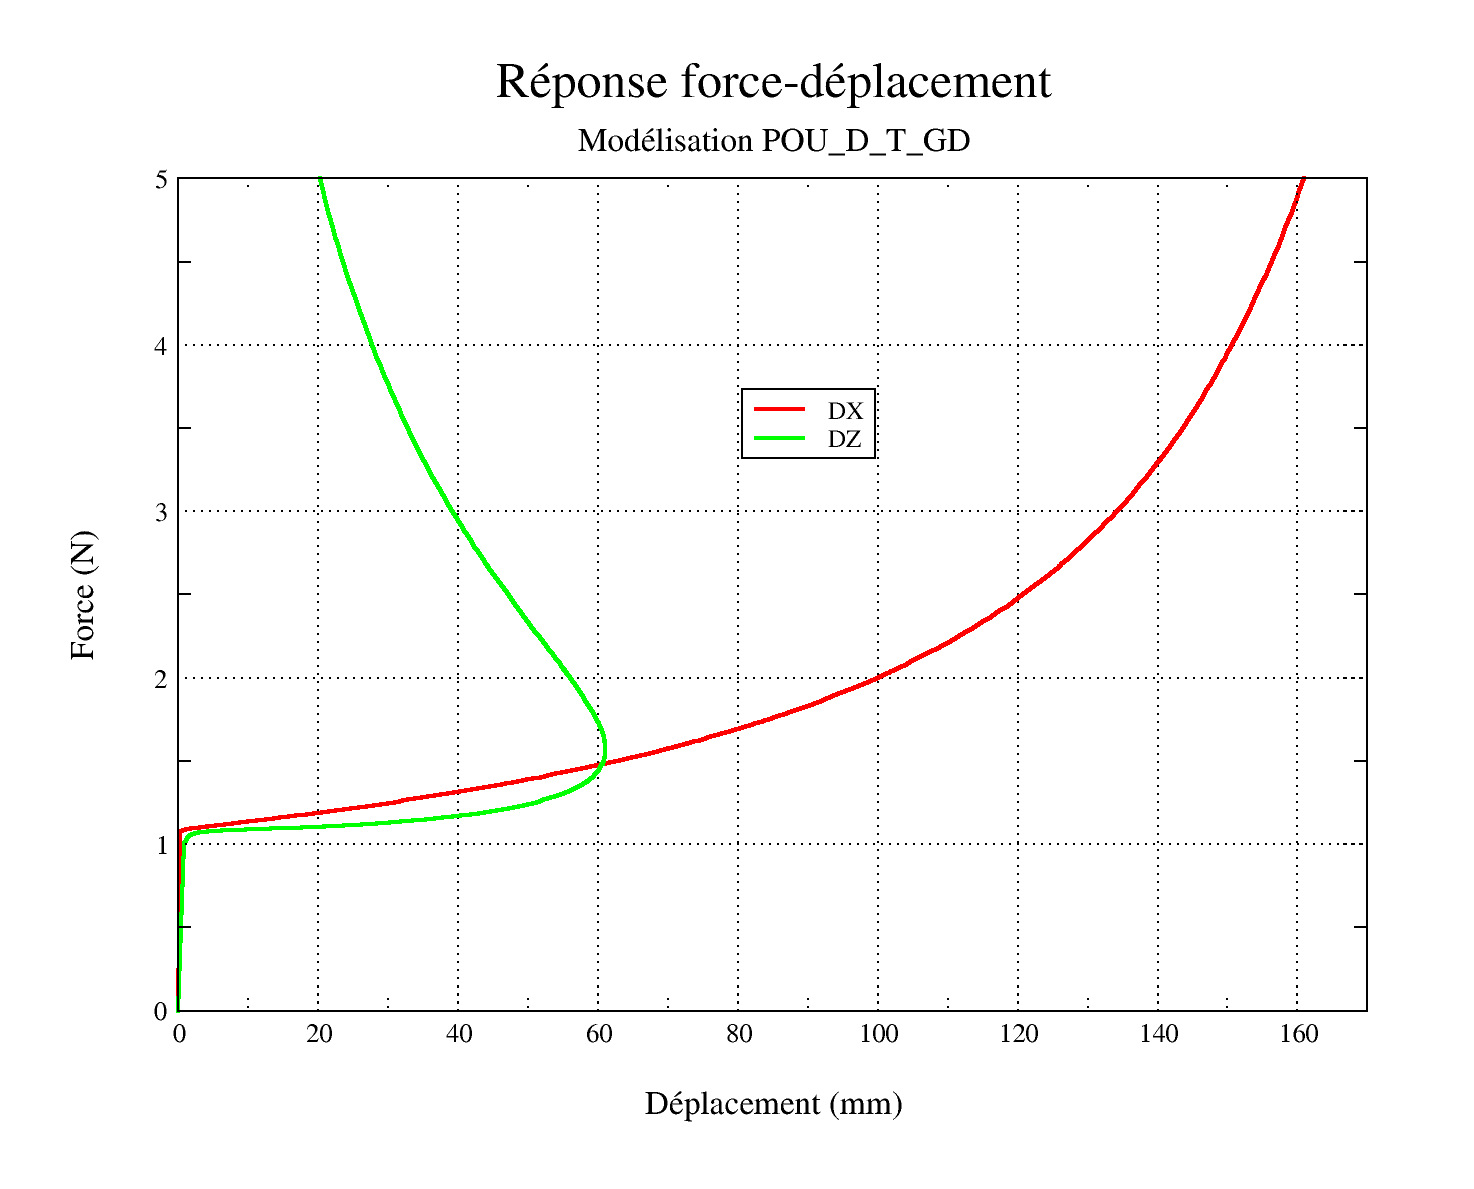
Figure 3.3.1-a: Force-Displacement Response, modeling POU_D_T_GD.
The values used as a reference for all other models are those in the table. The tolerances are adapted for the test to pass on the various platforms.
Effort (\(N\)) |
\(\mathit{DX}\) (\(\mathit{mm}\)) |
() |
\(\mathit{DZ}\) (\(\mathit{mm}\)) |
Tolerance/\(\mathit{DX}\) |
Tolerance/\(\mathit{DZ}\) |
1.0 |
1.9557493476051e-01 |
8.1849504447187e-01 |
1.0e-06 |
1.0e-06 |
1.0e-06 |
1.2 |
2.2002897190547e+01 |
4.5085481299695e+01 |
1.6e-05 |
1.2e-05 |
1.2e-05 |
1.4 |
5.1370576657920e+01 |
5.9127404636640e+01 |
3.7e-06 |
5.3e-06 |
5.3e-06 |
1.6 |
7.2308205991507e+01 |
6.1009065262385e+01 |
5.9e-06 |
9.7e-06 |
9.7e-06 |
2.0 |
9.9971410898183e+01 |
5.5985793815570e+01 |
2.6e-06 |
7.8e-06 |
7.8e-06 |
3.0 |
1.3415732610325e+02 |
3.9186782348842e+01 |
1.0e-06 |
7.0e-06 |
7.0e-06 |
4.0 |
1.5070726838590e+02 |
2.7660150436455e+01 |
1.0e-06 |
6.5e-06 |
6.5e-06 |
5.0 |
1.6092764983263e+02 |
2.0199366888417e+01 |
1.0e-06 |
6.2e-06 |
6.2e-06 |
Table 3.3.1-a: reference values.
3.4. notes#
The strategy adopted to obtain the force-displacement response of the structure is to pilot effort.
It is also necessary to use the automatic subdivision of the time step. Indeed, the element POU_D_T_GD does not uniformly converge into a residue and it is therefore difficult to complete a calculation with a uniform division of time unless you take very small steps of time, which is sub-optimal.