3. Modeling A#
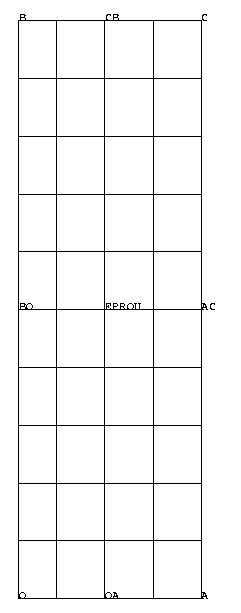
3.1. Characteristics of the mesh#


Number of knots: 149
Number of meshes and types: 40 elements QUAD8
3.2. Tested sizes and results#
Identification of a \(m\) common to the three experimental bases and a \({\sigma }_{u}\) per base.
Temperature \([°C]\) |
Reference |
Calculated values |
|||||
MAXI_VRAI |
REGR_LINE |
||||||
\(m\) |
\({\sigma }_{u}\) \([\mathrm{MPa}]\) |
\(m\) |
\({\sigma }_{u}\) \([\mathit{MPa}]\) |
\(m\) |
\({\sigma }_{u}\) \([\mathit{MPa}]\) |
||
—50 |
24 |
2800 |
26.7 |
2536 |
16.1 |
4983 |
|
—100 |
24 |
2700 |
26.7 |
2428 |
16.1 |
4642 |
|
—150 |
24 |
2600 |
26.7 |
2372 |
16.1 |
4555 |
|
3.3. notes#
Using the maximum likelihood method, although the difference between the values of (\(m\), \({\sigma }_{u}\)) obtained with RECA_WEIBULL and their reference values remains not negligible, it is in accordance with the result sought considering the relatively small number of samples used for the calibration (15 per temperature). To obtain the reference values it would be necessary to considerably increase the number of samples per temperature (\(N>1000\)). However, the difference observed remains reasonable (of the order of 10%). In addition, the growth of \({\sigma }_{u}\) as a function of temperature is respected.
With the linear regression method, the difference is greater.