2. Modeling A#
2.1. Characteristics of modeling#
Elements POU_D_T.
2.2. Characteristics of the mesh#
Number of nodes |
Number of elements |
79 |
78 |
Table 2.2-1
2.3. Tested sizes and results#
Point |
Quantity and Unit |
Value AFNOR |
Value |
Value Pipestress |
Value Aster |
Variance Aster- AFNOR |
(%) » |
||||||
5 |
|
-0.030774 |
-0.03077019 |
-0.030779 |
0.1 (*) |
|
20 |
|
0.030774 |
0.03077273 |
0.030779 |
0.1 (*) |
|
10 |
v-arrow (mm) |
-19.206 |
-19.206 |
-19.214 |
-19.21638186 |
0.1 (*) |
20 |
v-arrow (mm) |
53.912 |
53.912 |
53.920 |
53.920 |
0.1 (*) |
Table 2.3-1
(*): the value of the difference of 0.1% being the default value for verification by the operator TEST_RESU is indicated when the actual difference is smaller than the default value.
2.4. Displacement#
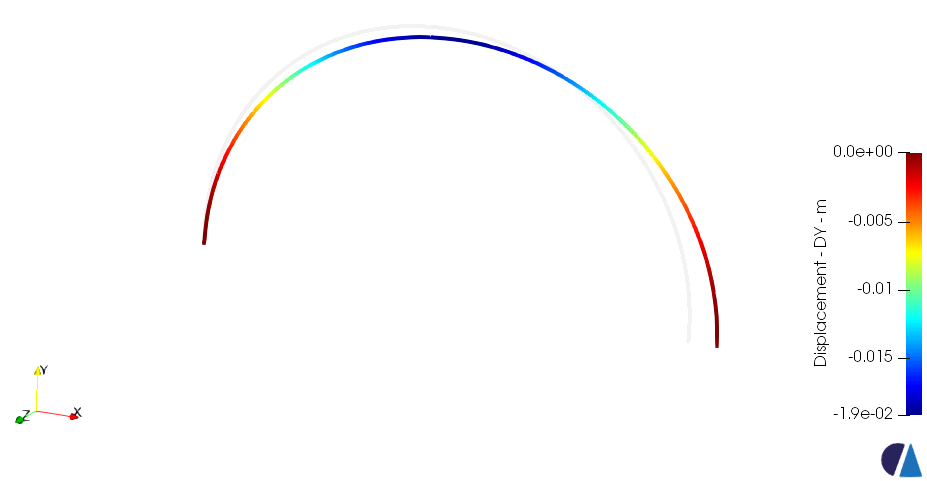
Figure 2.4-1