5. Summary of results#
The shapes of the variations of the response modules calculated at the top of each building (direct response and coupled response, respectively in blue and green) are represented on the same graph as those obtained by the test program NUPEC (respectively in red and black). The agreement between calculations and tests is very satisfactory with a relative difference of around 6%.
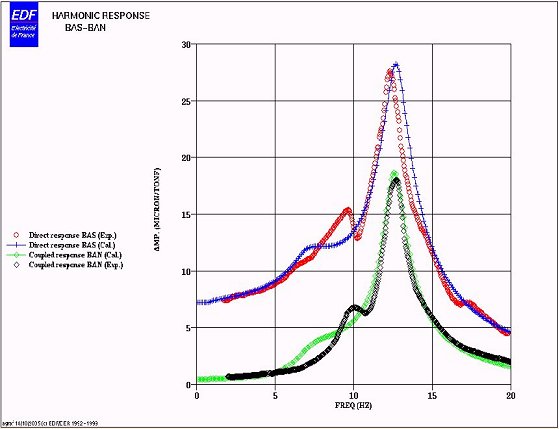
Figure 5: calculated and measured changes in the module of direct responses coupled with harmonic excitation in buried foundations in the direction \(Y\).