5. Analysis of the results#
In static terms, the estimate made by POST_NEWMARK is very close to that obtained by GeoSlope (1.189).
In dynamics, the results between the two programs are different, because taking into account the boundary conditions is not the same. Figure 3 shows the average acceleration of the drag zone between the GeoSlope calculation and code_aster. In particular, we can see that the acceleration peaks are attenuated by the boundary conditions in the solution obtained by code_aster, because no material damping hypothesis is integrated into the modeling.
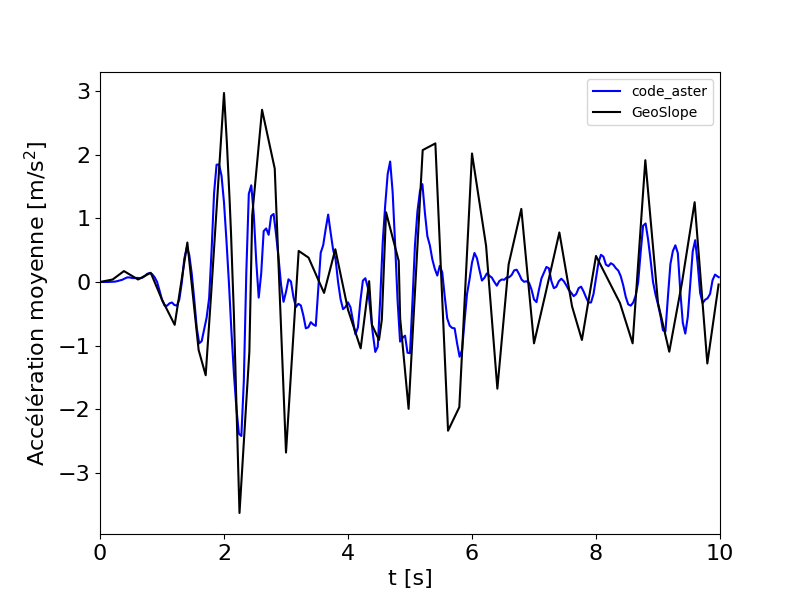
Figure 3- Average acceleration of the sliding zone
By the same reasoning, we observe that the variations in the safety factor during the dynamic calculation are lower than those obtained by GeoSlope, an index of strong variations in normal and tangential stresses. The trends are similar, except in particular between 6 and 8 seconds: in fact, modeling with code_aster and POST_NEWMARK predicts low stress variations, in connection with an almost zero acceleration of the input signal (Figure 1). However, strong variations are present in the GeoSlope solution, which is an index of a wave trapped in the model by the boundary conditions.
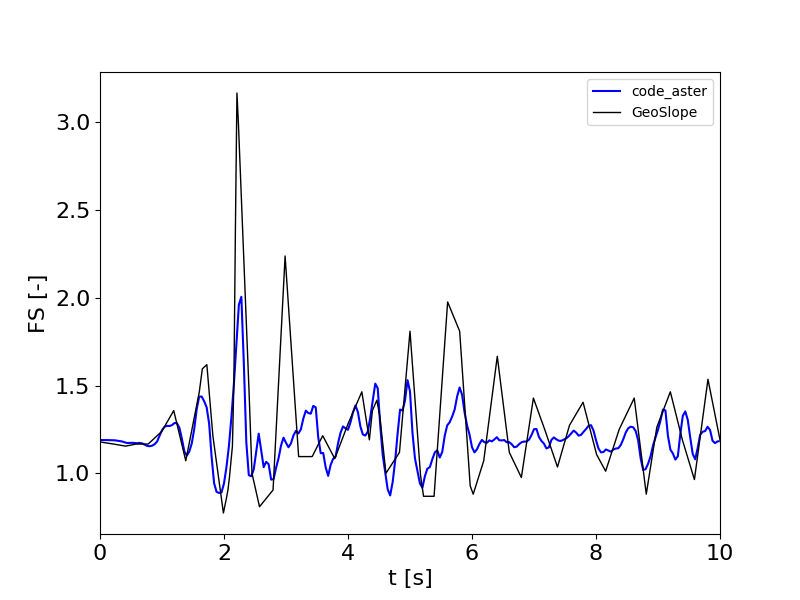
Figure 4- Temporal evolution of the dynamic safety factor
The reference case also analyzes the evolution of the safety factor with average acceleration. In this case, it is observed that modeling with code_aster and GeoSlope gives similar results, with a similar curvature despite a greater dispersion with code_aster (even if the low number of post-processing points presented in the reference case with GeoSlope suggests that there is an internal choice made for the analysis moments, different from the earthquake simulation step at the input of the calculation).
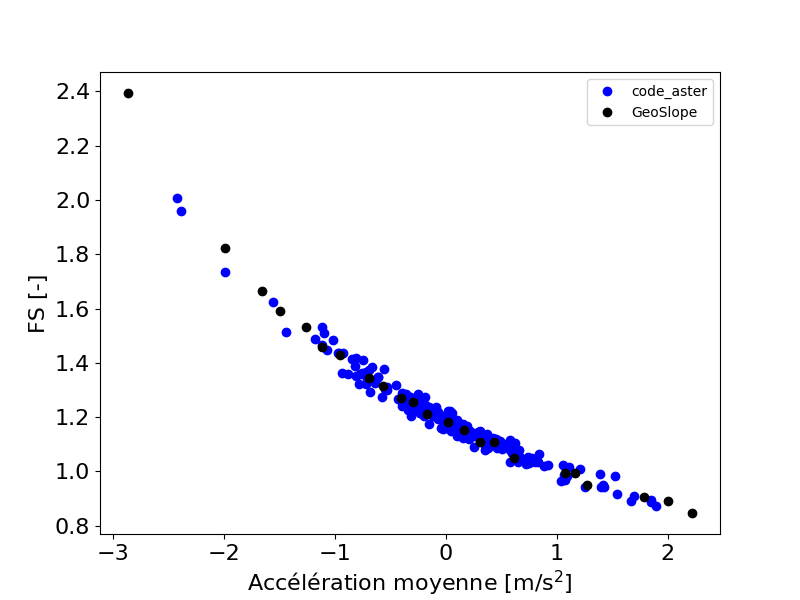
Figure 5- Evolution of the safety factor with average acceleration.
Considering a critical acceleration value of 0.1g (equal to that which induces a unit safety factor in Figure 5), the irreversible displacement predicted by the GeoSlope modeling and POST_NEWMARK are represented in Figure 6. It is observed that the displacements obtained in code_aster are lower, because the average acceleration is lower. Having effective boundary conditions is a significant source of margin for this type of approach to justify the seismic performance of embankments without taking into account water pressures.
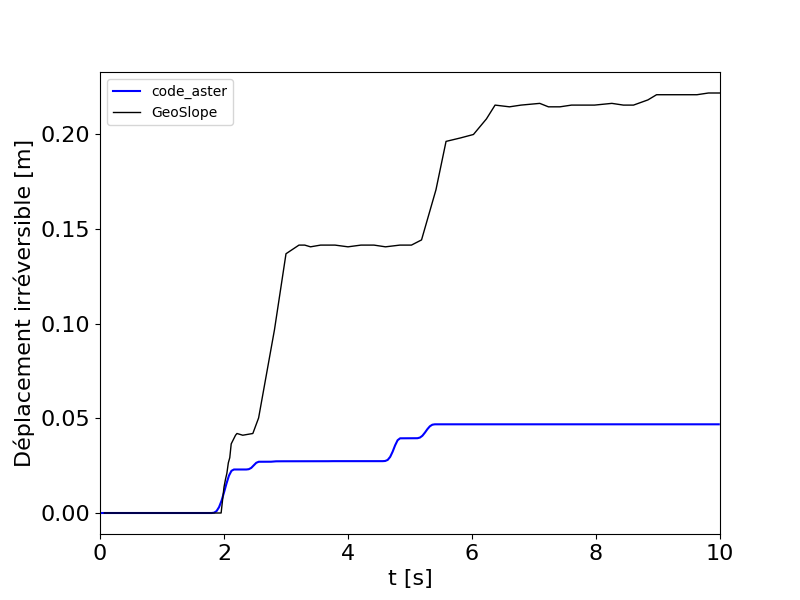
Figure 6- Temporal evolution of the irreversible displacement estimated by the Newmark method