3. B modeling (POU_D_EM)#
3.1. Characteristics of modeling#
Longitudinal mesh of the beam:
It is composed of 17 nodes and 16 pairs of POU_D_EM elements (16 elements for concrete and 16 for steel).
Beam cross section:
The concrete is modelled by a mesh (DEFI_GEOM_FIBRE/SECT) composed of \(2\times 20\) quadrilaterals (40 fibers)

Figure 3.1-a: Discretization of the section
Steel is modelled by 4 point fibers (DEFI_GEOM_FIBRE/FIBRE)
Depreciation coefficients \(\alpha\) and \(\beta\) are calculated using the following formula
\(\left\{\begin{array}{c}\alpha \\ \beta \end{array}\right\}\mathrm{=}2\frac{{\omega }_{1}{\omega }_{2}}{{\omega }_{2}^{2}\mathrm{-}{\omega }_{1}^{2}}\left\{\begin{array}{cc}\frac{1}{{\omega }_{2}}& \frac{1}{{\omega }_{1}}\\ {\omega }_{2}& \mathrm{-}{\omega }_{1}\end{array}\right\}\left\{\begin{array}{c}{\xi }_{1}\\ {\xi }_{2}\end{array}\right\}\)
where \({\omega }_{1}\) and \({\omega }_{2}\) are the first two natural pulsations \((\omega =2\pi f)\) and \({\xi }_{1}\) and \({\xi }_{2}\) are the desired damping on the first two modes.
With \({f}_{1}=37.8\mathrm{Hz}\) and \({f}_{2}=149.2\mathrm{Hz}\) (see paragraph [§4]), for modal depreciations of \(\text{5\%}\), we find: \(\alpha =8.5{10}^{-5}\) and \(\beta =18.985\).
For the calculation of the temporal response, the time step chosen is 1/100th of a second.
3.2 Tested quantities and results
The reaction curves as a function of time and the arrow in the center as a function of time are shown in figures [Figure 4-a] to [Figure 4-d].
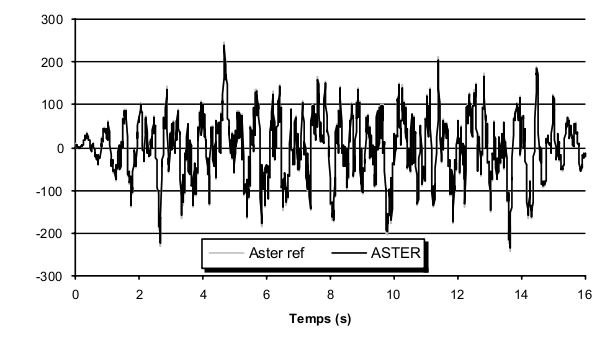
Figure 4-a: Reaction to the first press as a function of time
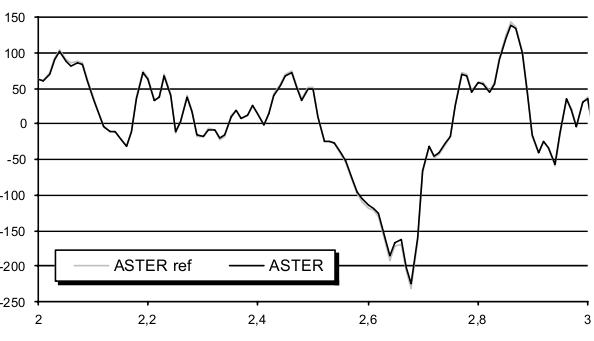
Figure 4-b: Detail of the reaction between 2 and 3 seconds
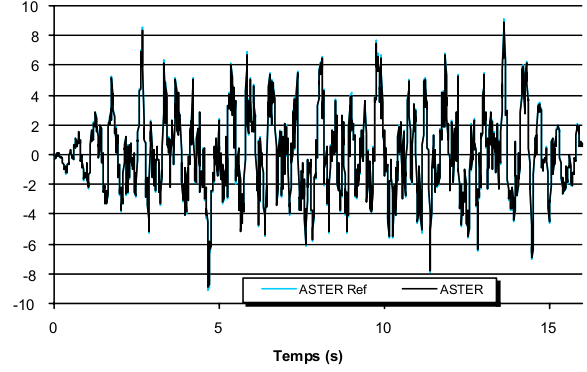
Figure 4-c: Arrow in the center as a function of time
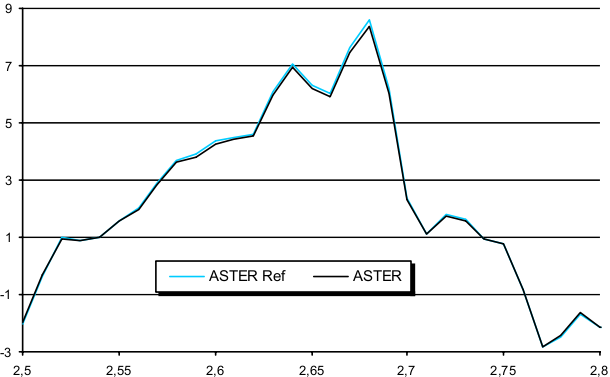
Figure 4-d: Detail of the arrow between 2.5 and 2.8 seconds
Results tests (TEST_RESU) are carried out for the first three natural frequencies. The reaction on the first press is also tested and the arrow in the center is tested at the times \(\mathrm{1s}\) (step 100) and \(\mathrm{2s}\) (step 200), then for the first 2 extremes of the curves, at the times \(\mathrm{2,68}s\) (step 268) and the arrow in the center are tested at the moments (step 268) and \(\mathrm{4,68}s\) (step 468).
Natural frequency |
ASTER Ref |
ASTER |
Relative error % |
1 |
37.80 |
37.83 |
0.07 |
2 |
149.20 |
149.28 |
0.05 |
3 |
200.30 |
200.39 |
0.04 |
REACTION |
ASTER Ref |
ASTER |
E relative error % |
|
\(\mathrm{1,00}s\) |
1,8878.104 |
1,8479.104 |
2,1 |
|
\(\mathrm{2,00}s\) |
6,3393.104 |
6,2184.104 |
1,9 |
|
\(\mathrm{2,68}s\) |
—2,3222.105 |
—2,2443.105 |
3,4 |
|
\(\mathrm{4,68}s\) |
2,4692,105 |
2,3979,105 |
2,9 |
FLECHE |
ASTER Ref |
ASTER |
Relative error % |
1.00 s |
—6,0694.10—4 |
—5,9846.10—4 |
1,4 |
2.00 s |
—2,3507.10—3 |
—2,3362.10—3 |
0.6 |
2.68 s |
8.5790.10—3 |
8.3929.10—3 |
2.2 |
4.68 s |
—9,1084.10—3 |
—8,9530.10—3 |
1,7 |