2. Benchmark solution#
The experimental measurements carried out on the Tanaka et al. device provide the reference values for the validation of the model.
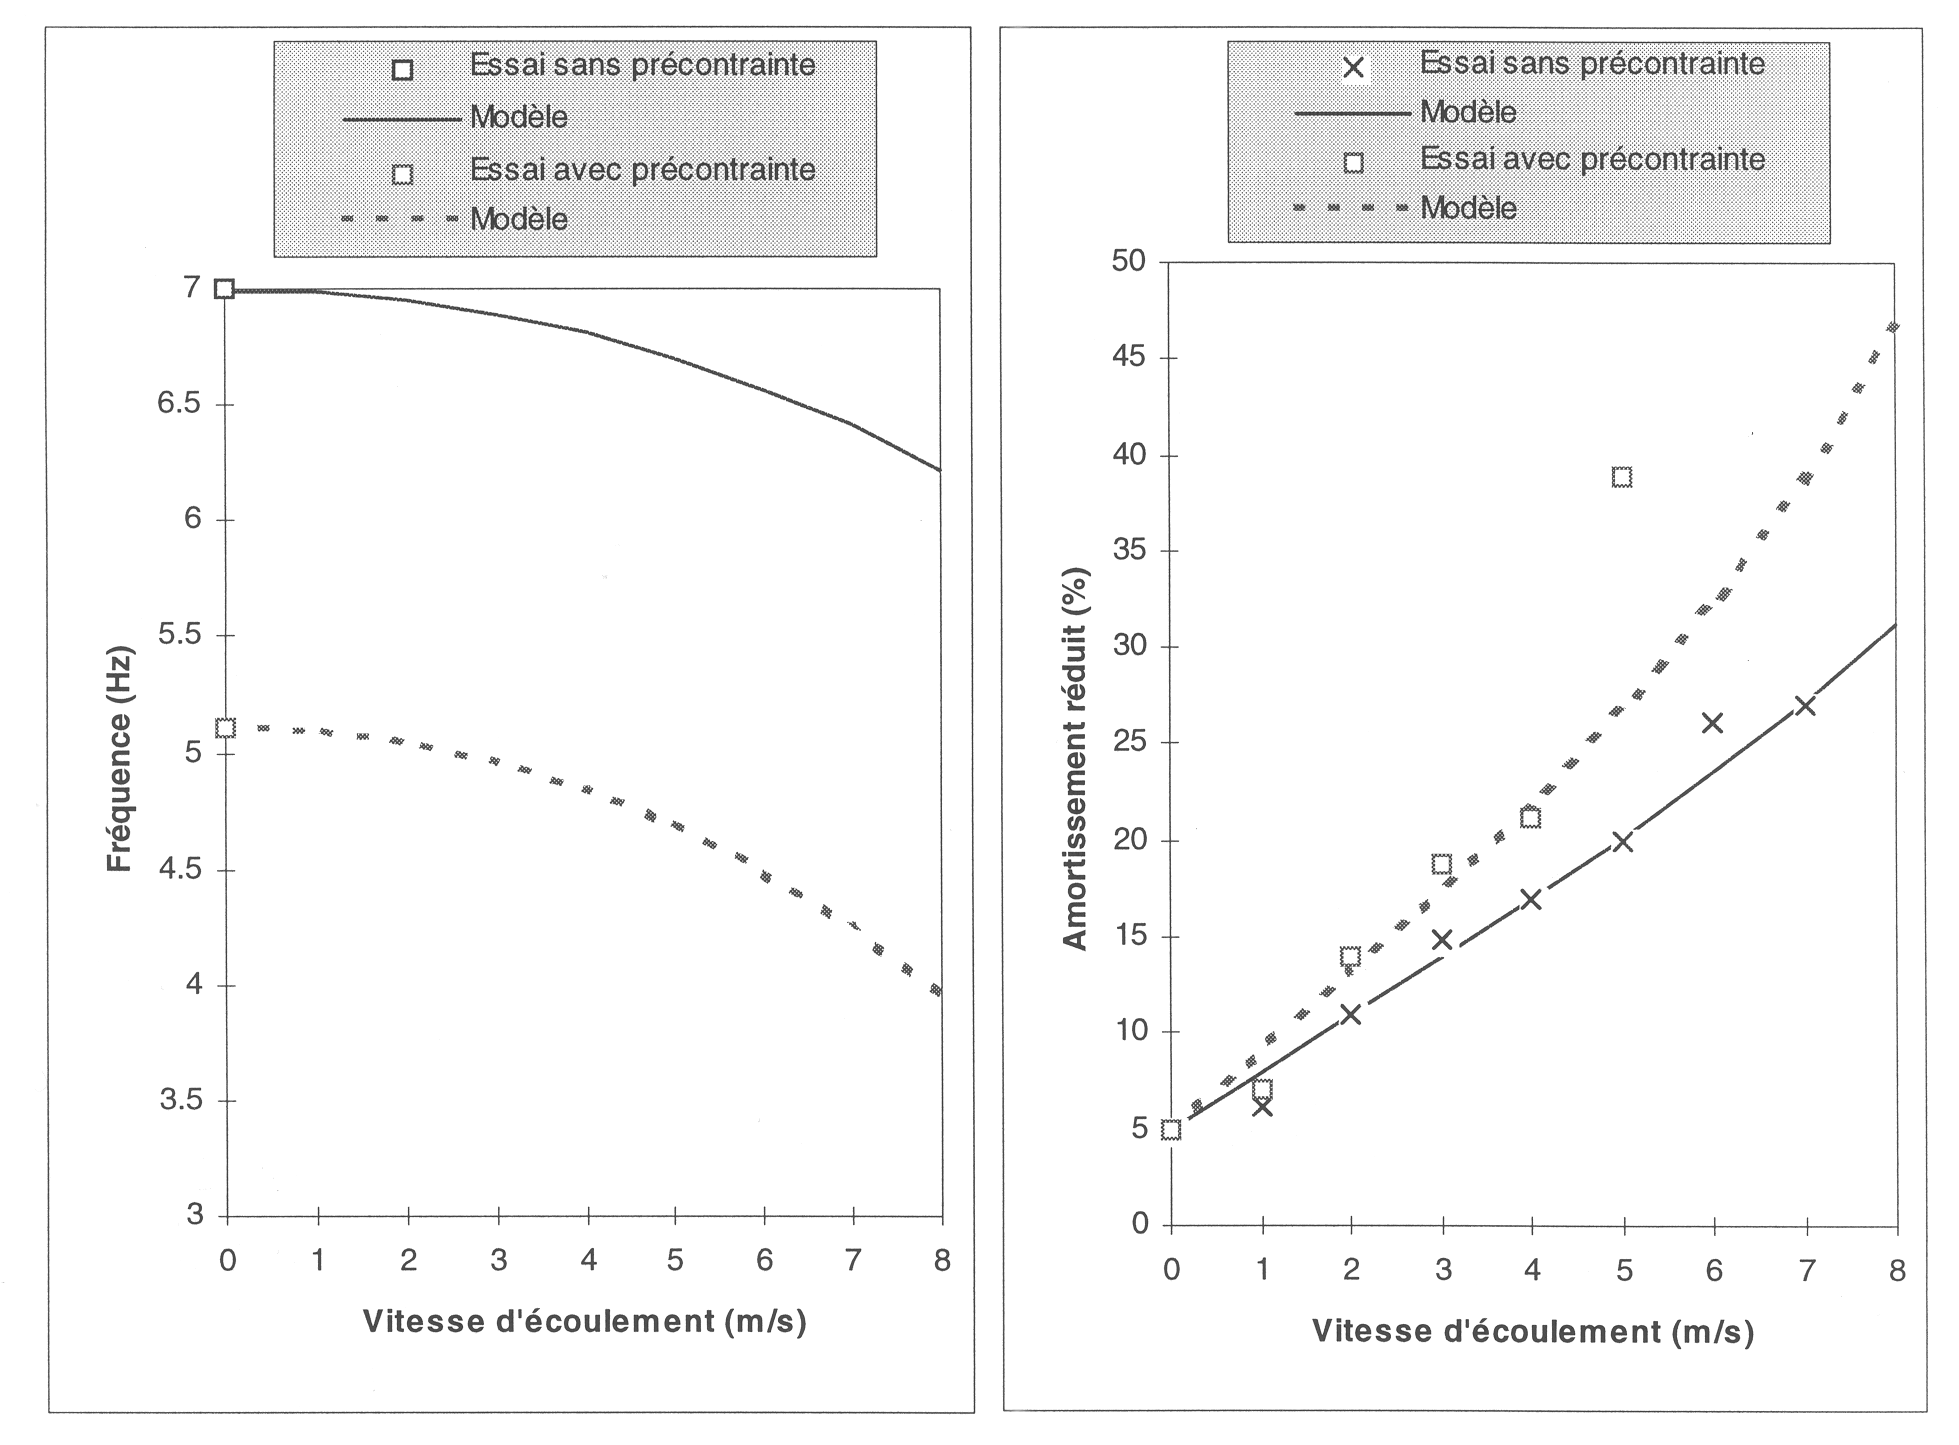
The two graphs below, representing the changes in the frequency and the reduced damping of the first double mode of bending as a function of the average flow speed, make it possible to compare the results of the model with the experimental results.
Given the uncertainties in the measurements, the relative deviation tolerance for model validation is quite broad. This is why experimental measurements cannot be used as reference values for the test case, as a tighter tolerance is required to ensure that the code does not regress. The reference values used are therefore those obtained numerically during the retrieval of the test case.