5. Illustrative study of civil engineering#
To illustrate the use of cables, we consider here the study of a prestressed enclosure subjected to an impact. The mesh of the structure is shown on the.
Materials
The behavior of reinforced concrete is modelled by the homogenized law GLRC_DAMAGE. In the area surrounding the impact zone, the material is assumed to behave in a non-linear manner. We therefore assign to a group of elements CYL_GLRCde this zone the parameters of the law of concrete behavior calculated using the software MOCO [7]. For more technical details on the data setting of an impact calculation with law GLRC_DAMAGE, we can consult the reference [8].
Material properties are shown in. Zone CYL_LINE also uses the CYL_DAMAGE behavior law, but in this case the tension and compression limits of concrete and reinforcements have been identified in order to model homogenized linear behavior. It is assumed that the impact will not cause damage to this area.
Concrete |
Reinforcements |
Prestress cables |
||
Young’s module (GPa) |
40 |
40 |
200 |
200 |
Poisson’s ratio |
0.2 |
|||
Traction limit (MPa) |
4 |
500 |
||
Compression limit (MPa) |
40 |
|||
Work hardening module (GPa) |
2 |
Table 5-1 : Material Properties
Pre-stress cables
The cables have an initial tension imposed on \(\mathrm{3,75}\mathit{MN}\). In the case of the configuration with friction cables, an anchoring setback is considered for horizontal cables equal to \(\mathrm{5mm}\). The friction coefficients in this configuration are \(\varphi \mathrm{=}\mathrm{0,001}{m}^{\mathrm{-}1}\) for linear friction and \(f\mathrm{=}\mathrm{0,21}{\mathit{rad}}^{\mathrm{-}1}\) for curved friction. There is no initial tension loss due to friction for the other configurations.
Boundary conditions
The speaker is embedded at its base.
Loading
The load considered in the study is an impact on a small square area of the external surface of the cylinder. The impact is imposed by a pressure force on an area of about \(\mathrm{4,43}{m}^{2}\), identified by the mesh group CYL_PRES. This load corresponds to an impact force of \(\mathrm{26,6}\mathit{MN}\). The loading curve is given.
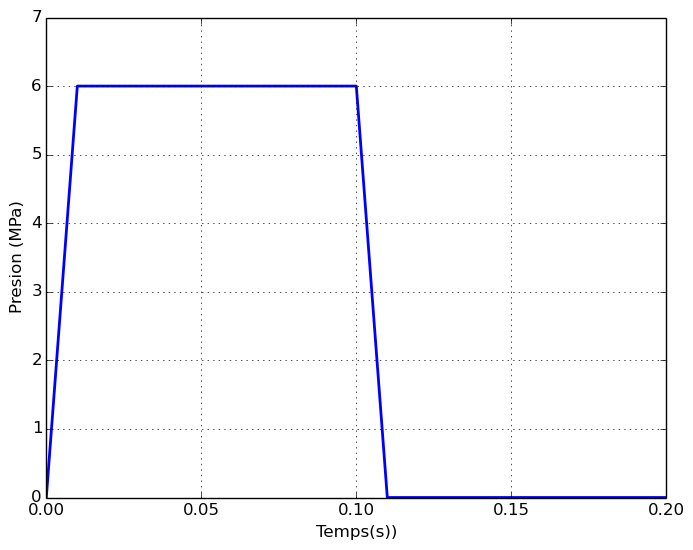
Figure 5-a : Load curve
Calculation parameter
A fixed calculation step equal to \({5.10}^{\mathrm{-}6}s\) is used. The calculation is carried out up to the instant 0.2 s.
5.1. Prestressed condition#
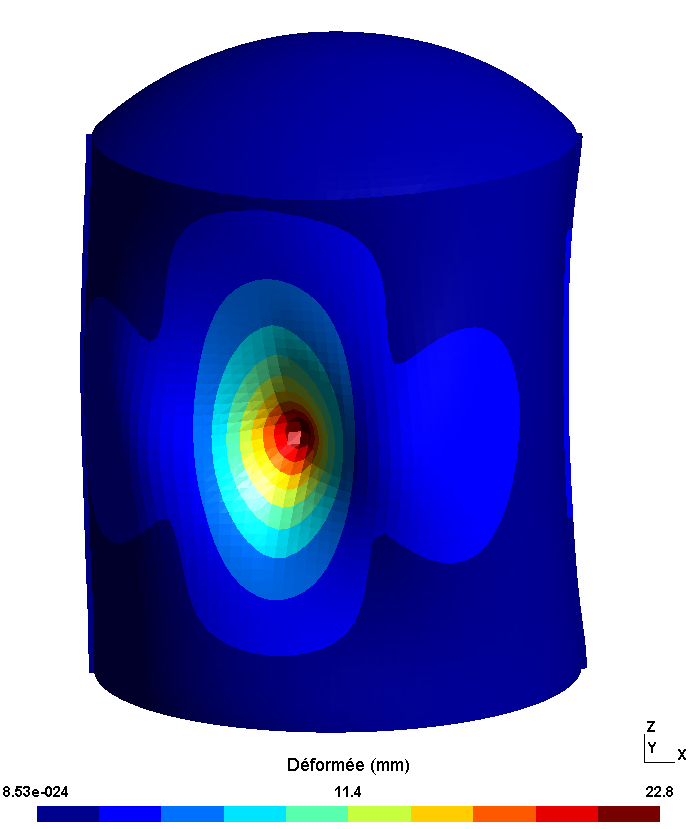
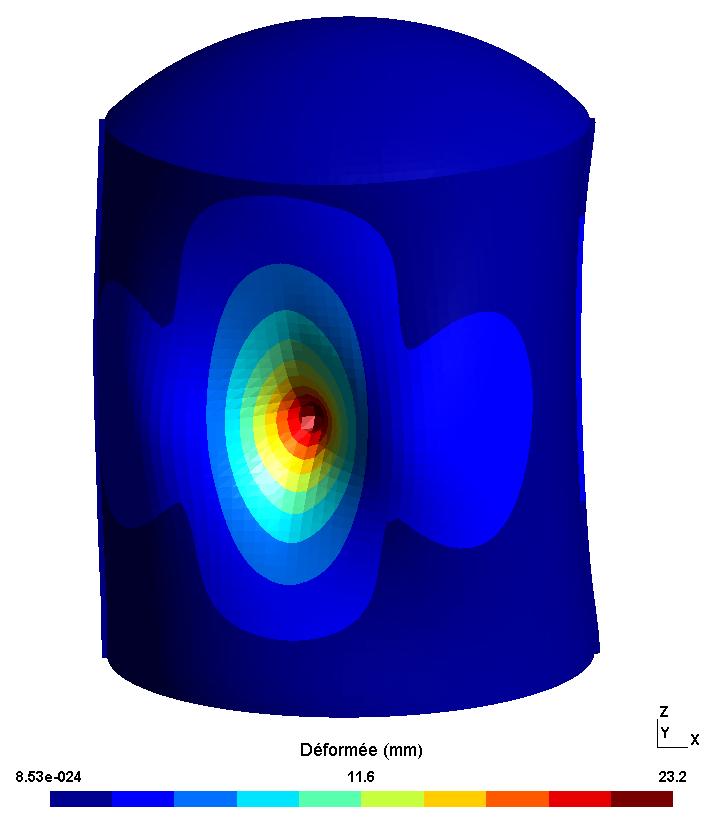
Following prestress in Code-Aster, via the CALC_PRECONT macro command, the structure is deformed by the tension of the cables. The deformations obtained for the three study configurations are presented with an amplification factor of 5000.
In all three cases, a reduction in the diameter of the cylinder and a collapse of the dome are observed. It should be noted that the deformation for the adherent and sliding cable configurations is identical.
Adherent cables |
Sliding cables |
Rubbing cables |
|
|
|
Figure 5.1.1-a : Deformed following prestress (amplification factor 5000)
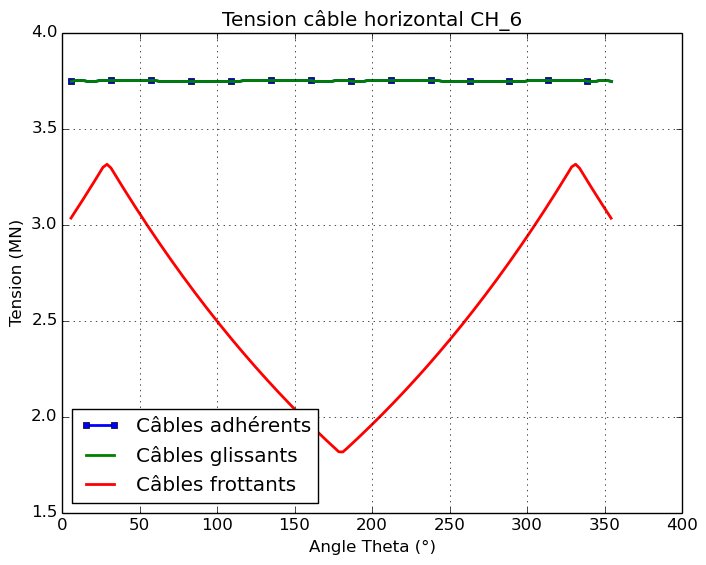
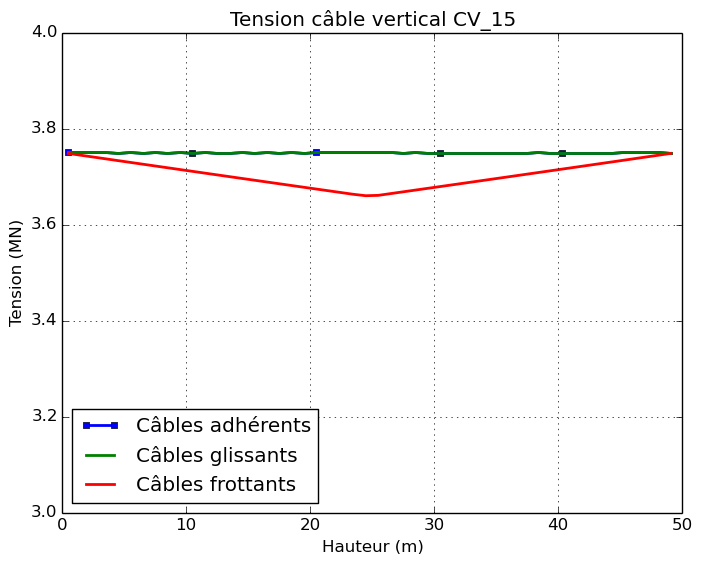
The tension of the cables, resulting from the pretension, is defined by the macro-command CALC_PRECONT which follows the rules of BPEL [3]. The tension profiles therefore depend on the friction parameters and the anchoring recoil. It is possible to apply friction coefficients to all types of cables to represent tension in a realistic way. In the case of this study, no coefficient of friction is imposed, nor anchoring recoil for adherent and sliding cables. The comparison of the tensions along the horizontal and vertical cables (see Figure) confirms that the prestress imposed is identical in these two cases. The cable tension is constant along the cables, equal to \(\mathrm{3,75}\mathit{MN}\).
In the case of the configuration with friction cables, linear friction, curved friction and anchoring recoil are considered for horizontal cables. This is reflected in varying tension profiles along the cable. For vertical cables, there is a loss of tension between the center of the cable and the ends due to the linear friction coefficient. For horizontal cables, the loss of tension between the center of the cables and the ends is more pronounced because the curved friction is more important than the linear friction. The voltage varies between \(\mathrm{1,8}\mathit{MN}\) and \(\mathrm{3,2}\mathit{MN}\). The peak tension is not measured at the ends of the cables due to the anchoring recoil in question. The significant decrease in the effective tension of horizontal cables leads to a deformation of the structure that is less pronounced than in the case of adherent and slippery cables. The variation in tension along the friction cables can also lead to an asymmetry in the behavior of the structure. It is therefore important to correctly model the position of the cable anchors, i.e. an alternation of anchors on both sides of the structure. This ensures uniform prestress.
|
|
Figure 5.1.1-b : Voltage along the cables
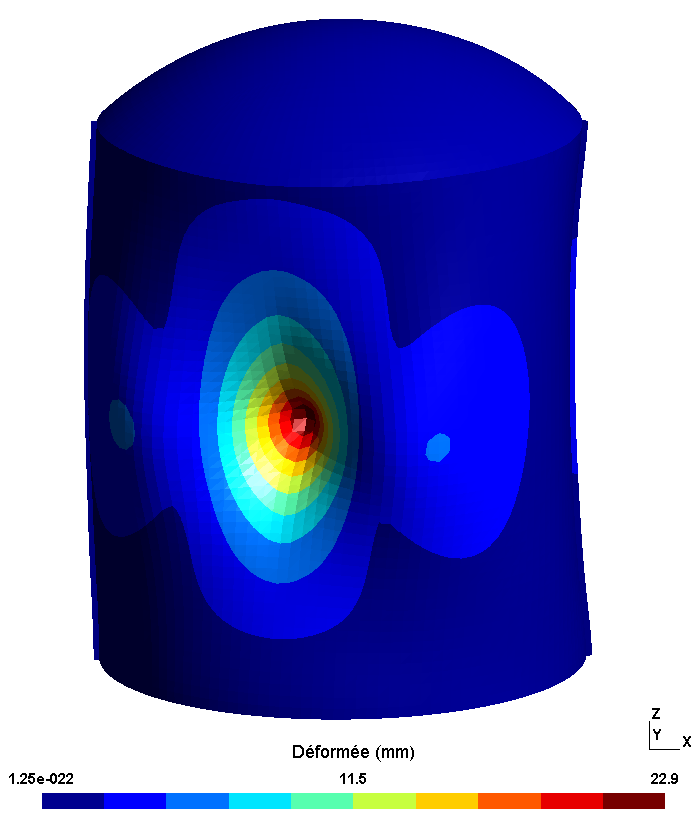
5.2. Status during loading#
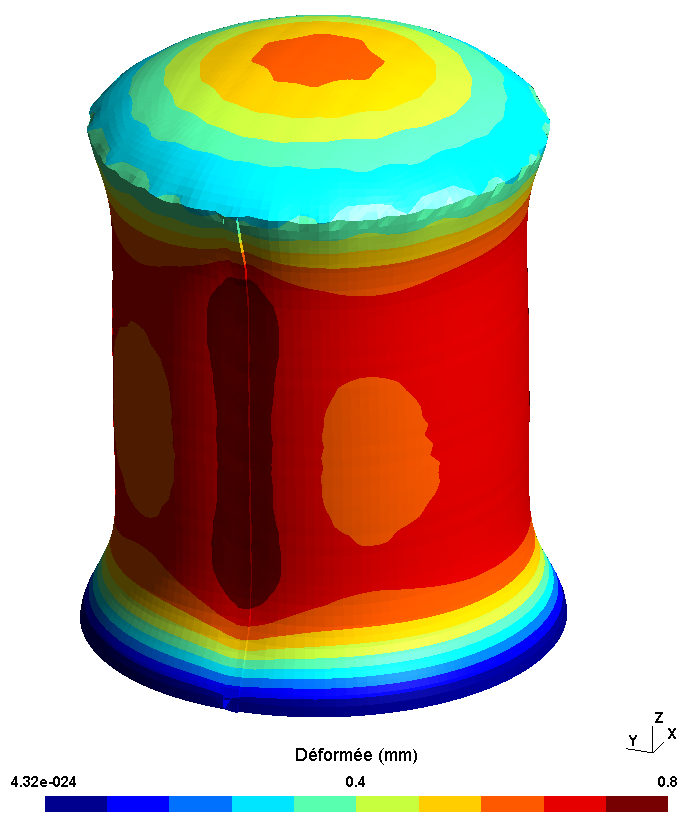
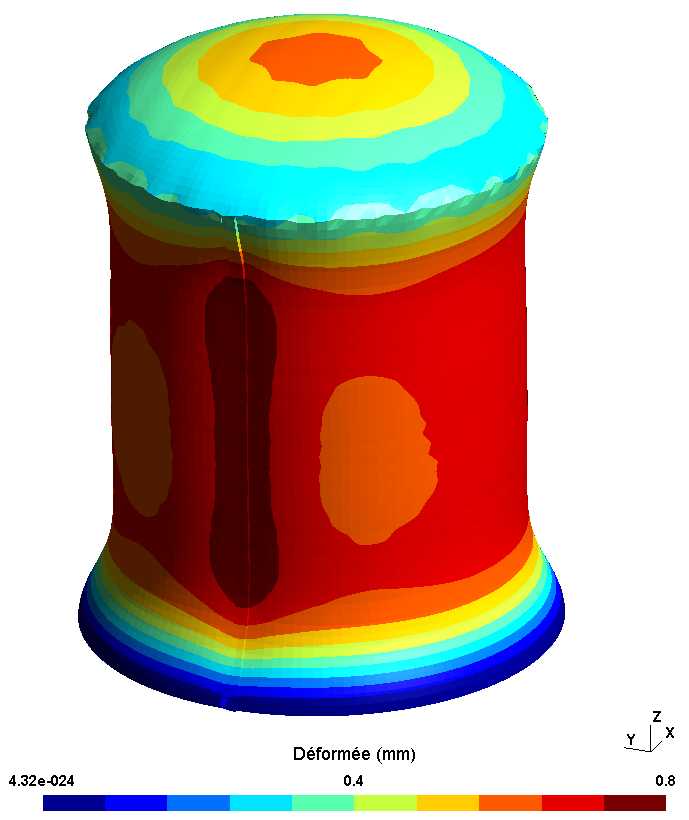
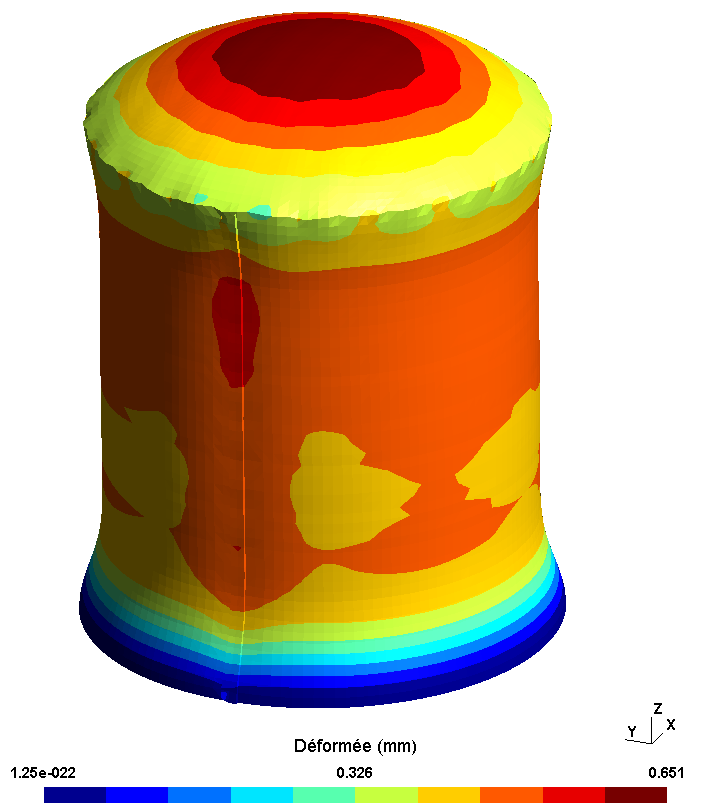
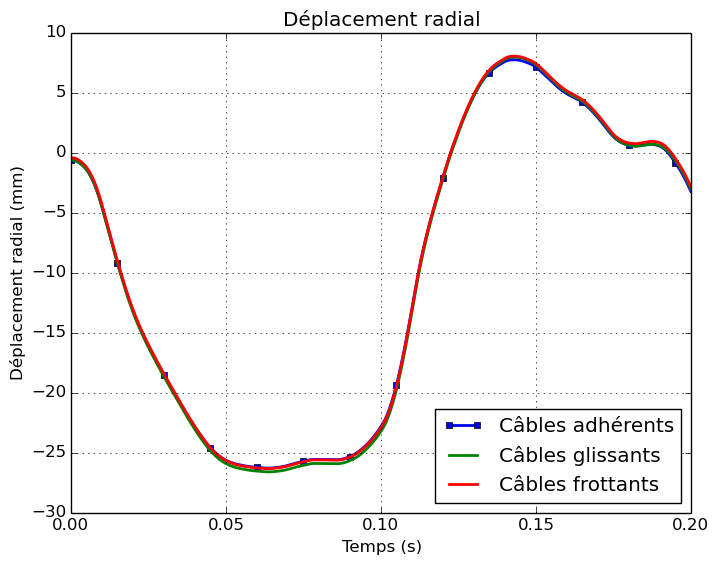
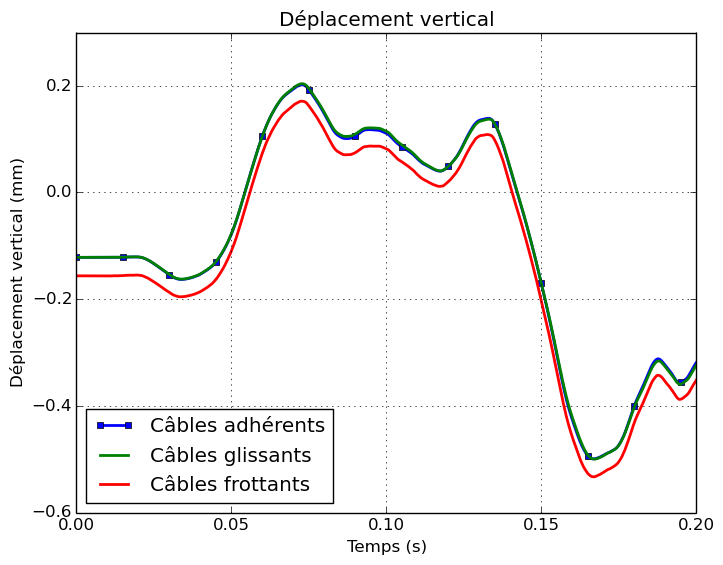
During the impact, the structure of the enclosure is deformed locally at the level of impact zone CYL_PRES. The deformations of the chamber are given for the calculation times \(\mathrm{0,1}s\) and \(\mathrm{0,2}s\). The displacement of the center of the impact zone is also presented: the radial and vertical component of the displacement is separated.
Moment |
Adherent cables |
Sliding cables |
Rubbing cables |
\(\mathrm{0,1}s\) |
|
|
|
\(\mathrm{0,2}s\) |
|
|
|
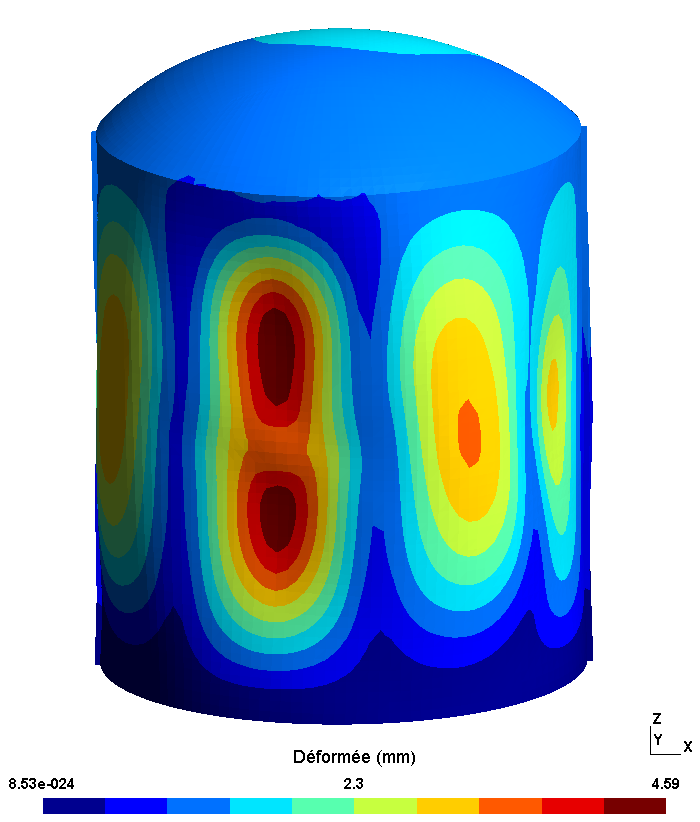
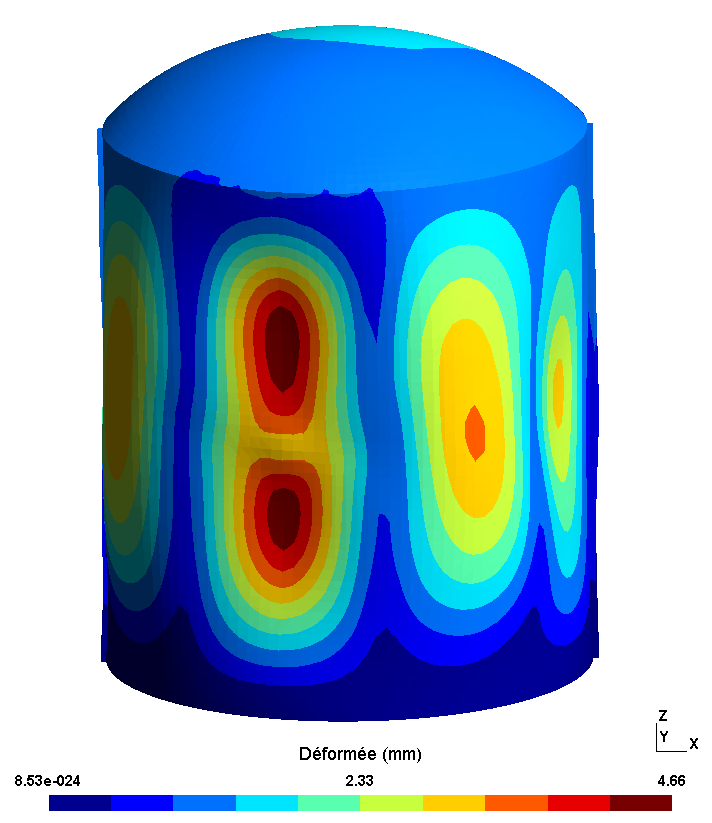
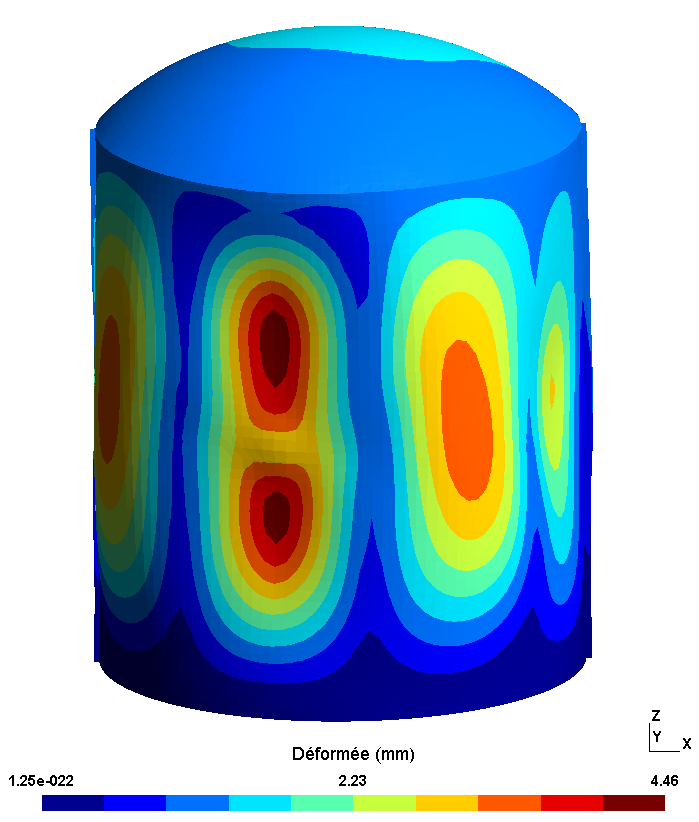
Figure 5.1.2-a : Structure deformations
The radial component of the displacement reaches a maximum amplitude of \(\mathrm{2,6}\mathit{cm}\). The impact zone initially moves towards the inside of the cylinder. At the end of loading, the displacement is reversed and becomes positive, which corresponds to a movement towards the outside of the cylinder. The bending wave propagates in the cylinder as can be visualized on the deformations at moment \(\mathrm{0,2}s\). The vertical displacement of the central point of the impact zone also varies during the calculation but the amplitude remains less than \(\mathrm{0,6}\mathit{mm}\).
|
|
Figure 5.1.2-b : Displacements from the center of the impact zone
The comparison of the three configurations shows that the overall response of the structure upon impact is little influenced by the choice of cable modeling.
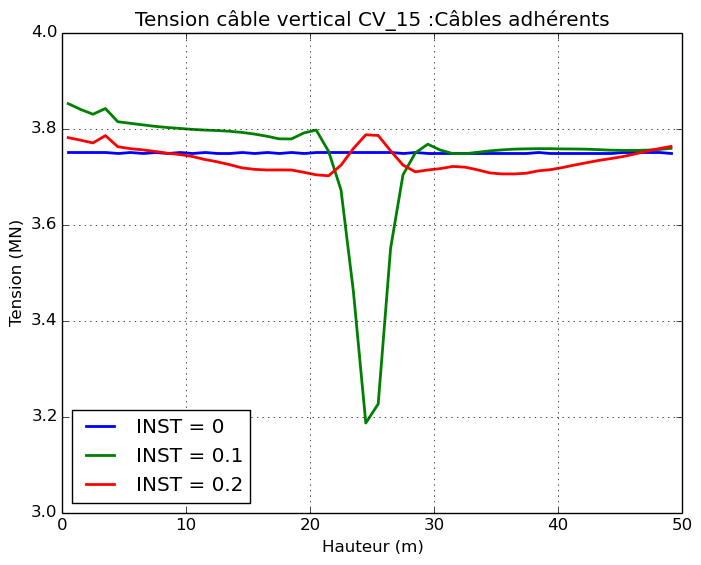
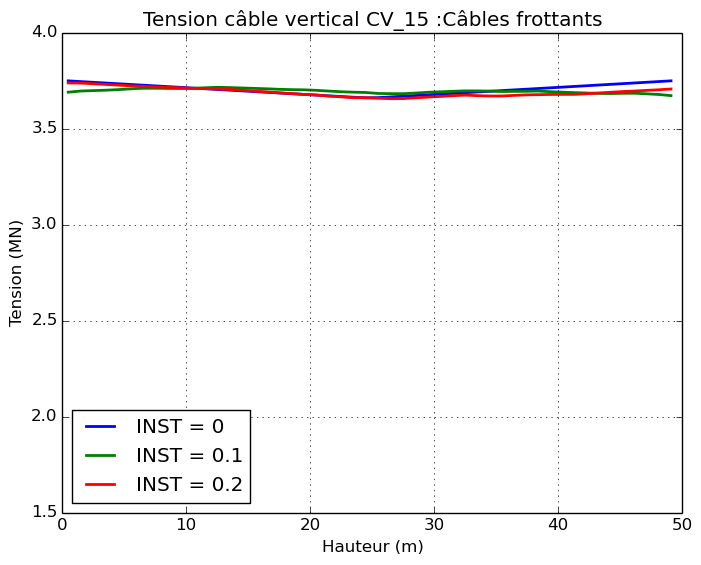
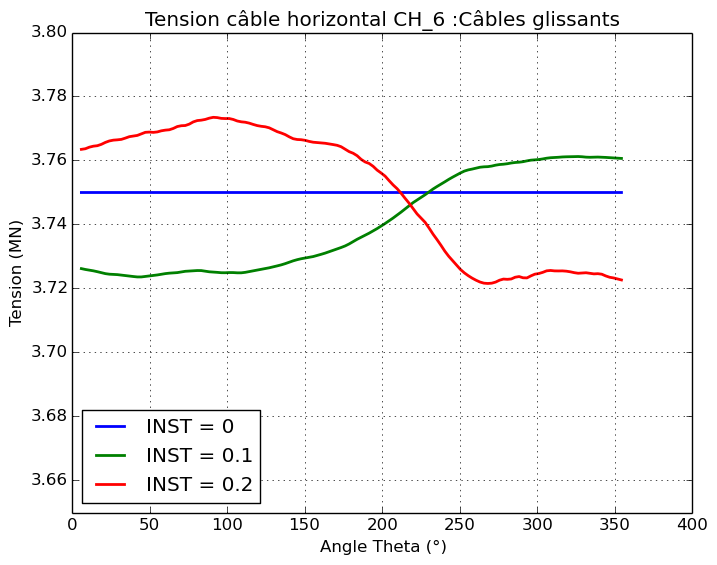
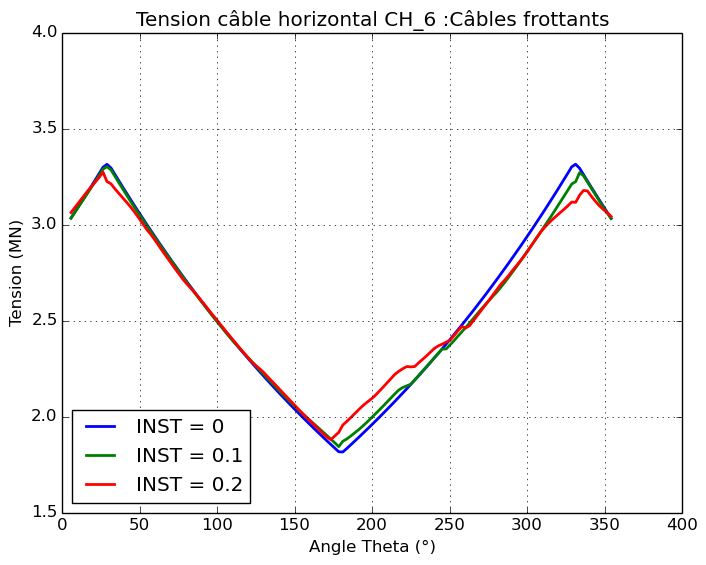
The differences appear when comparing the response of the cables themselves. The tension profile along the two cables crossing the impact zone, CH_06 and CV_15, is shown.
For adherent cables, the impact zone can be clearly identified along the cable (height ~ \(\mathrm{25m}\) and angle \(\theta \mathrm{=}250°\)). The local deformation of the reinforced concrete shell at the level of the impact zone is directly transmitted to the adherent cables via the kinematic links. Since the cables are positioned on the external face of the cylinder, the impact induces a compression force in the cables. The cable tension is reduced to \(\mathrm{3MN}\) locally for calculation time \(\mathrm{0,1}s\).
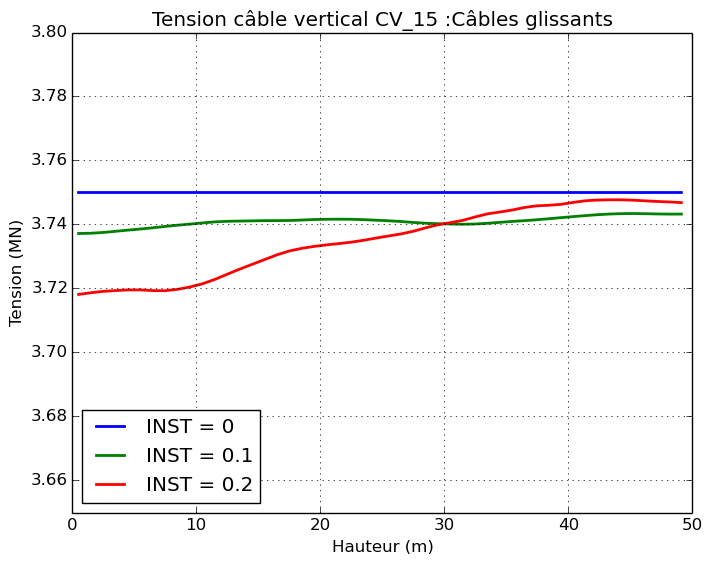
For slippery cables, the tension profile along the cables remains constant throughout the calculation around \(\mathrm{3,75}\mathit{MN}\). The authorized sliding of the cable in its sheath makes it possible to accommodate the significant deformations of the concrete shell in the impact zone.
For friction cables, the tension profile along the cables is not constant due to friction. The effect of the impact has little influence on the tension profile.
Cable |
Adherent cables |
Sliding cables |
Rubbing cables |
Vertical |
|
|
|
Horizontal |

|
|
|
Figure 5.1.2-c : Cable Tension Profiles
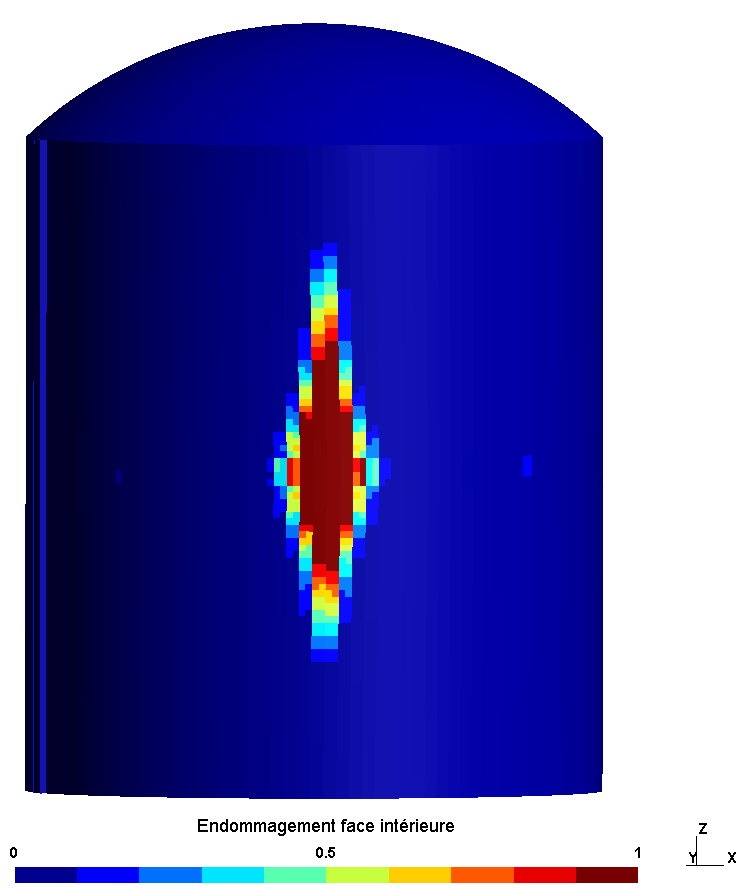
shows the damage to the interior and exterior face at the end of the calculation, at time \(t\mathrm{=}\mathrm{0,2}s\). The damage initially appears on the inside of the cylinder, which is subjected to a tensile force due to the impact. At the end of the application of the load, the return of the structure and the positive displacements cause damage to the external face of the cylinder.
The damage to the underside occurs around the impact zone and in the vertical direction. This result is consistent with the deformation of the structure at instant \(\mathrm{0,2}s\). The shock wave generates significant deformations above and below the impact zone.
The damage to the outer face is located around the impact zone and in the horizontal direction.
The damage is similar in the three study configurations.
Face |
Adherent cables |
Sliding cables |
Rubbing cables |
Inner |
|
|
|
Outside |
|
|
|
Figure 5.1.2-d : Damage at t =0.2s
The computation times on the Aster5 cluster for the three configurations are shown in the. The calculation time of the configuration with the friction cables is longer than for the other configurations because of the large number of discrete elements and the law of friction to be imposed.
Calculation time |
Adherent cables |
Sliding cables |
Rubbing cables |
|
Full calculation |
5.9 h |
6.7 h |
11.1 h |
|
Europlexus calculation |
4.2 h |
4.2 h |
5.1 h |
9.3 h |
Table 5.1.2-1 : Calculation time on Aster5
Calculation time |
Adherent cables |
Sliding cables |
Rubbing cables |
|
Full calculation |
5.9 h |
6.7 h |
11.1 h |
|
Europlexus calculation |
4.2 h |
4.2 h |
5.1 h |
9.3 h |