4. B modeling#
4.1. Characteristics of modeling#
The characteristics of modeling \(B\) are the same as those of modeling \(A\), except for:
the loading speed, which is 100 times faster: \({q}_{t}\) is equal to \(\mathrm{0,2}\mu {\mathrm{m.s}}^{-1}\).
the following material parameters
Young’s module |
\(39000\mathrm{MPa}\) |
Cracking energy \({G}_{c}\) |
|
Critical Constraint \({\sigma }_{c}\) |
|
Cohesive zone Biot module \(N\) |
|
Discretization in time: 42 time steps of \(\mathrm{0,1}s\).
4.2. Tested sizes and results#
The figure shows the force applied by the wedge as a function of CMOD.
The figure shows the pressure profiles along the crack. As expected and since the loading was faster, the fluid front spread less far to CMOD given.
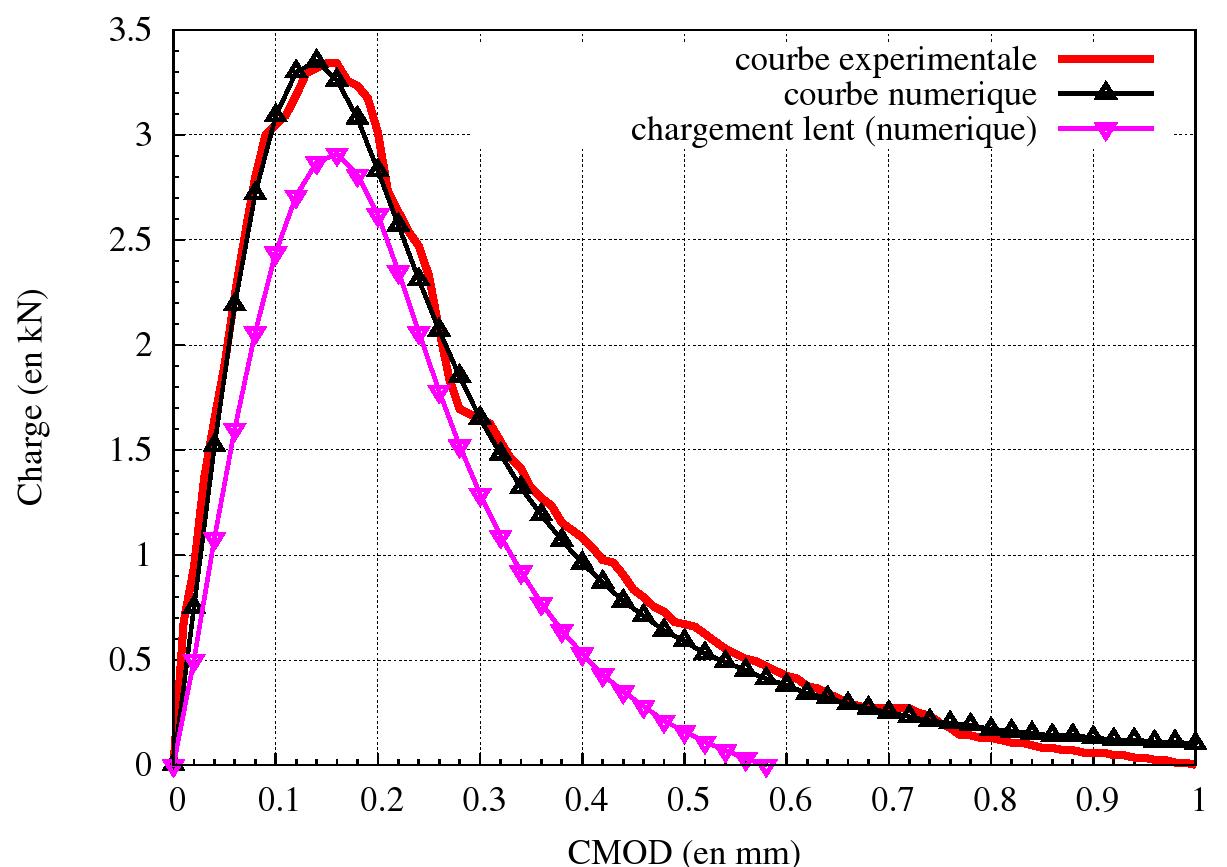
Figure 4.2-a : Force-CMOD curve obtained numerically and comparison with the experimental results of Slowik and Saouma. The curve obtained with a slower loading (modeling A) has been added for comparison.
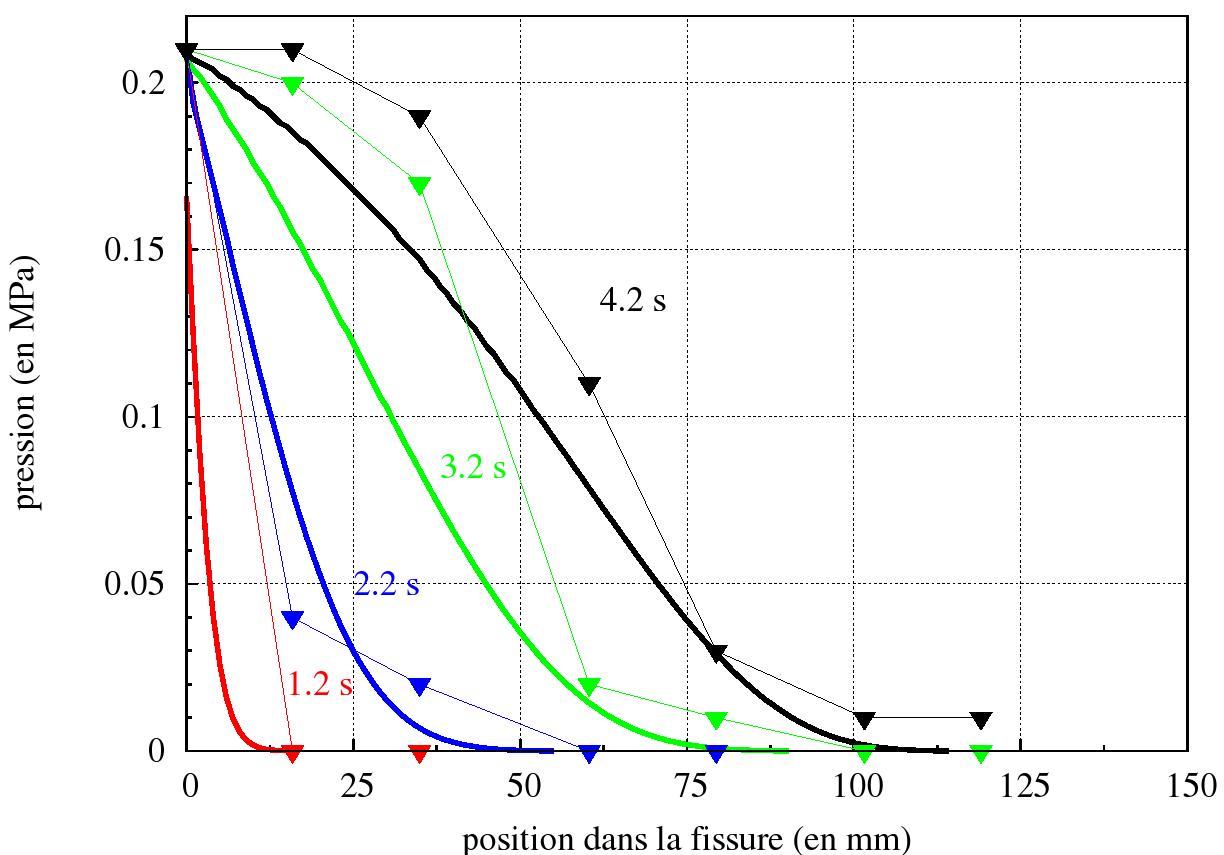
Figure 4.2-b : **Pressure profiles in the crack at different times. Numeric curves are thick curves. The experimental measurements (Slowik and Saouma) are represented by solid triangles
The overall mechanical response obtained is compared to the experimental results.
Point |
Time ( \(s\) ) |
\(\mathrm{Fx}\) ( \(\mathrm{kN}/{\mathrm{mm}}^{\mathrm{²}}\) ) reference |
\(\mathrm{Fx}\) ( \(\mathrm{kN}/{\mathrm{mm}}^{\mathrm{²}}\) ) Aster |
Difference ( \(\text{\%}\) ) |
|
\(B\text{'}\) |
1.0 |
-15.06 |
-15.06 |
-14.16 |
6.0 |
\(B\text{'}\) |
2,0 |
-5,41 |
-4,41 |
-4,73 |
13,0 |
\(B\text{'}\) |
3.8 |
-0.882 |
-0.882 |
-0.834 |
5.4 |
The following non-regression tests are added:
\(X\) ( \(\mathrm{mm}\) ) |
\(Y\) ( \(\mathrm{mm}\) ) |
Time ( \(s\) ) |
\(\mathrm{PRE1}\) ( \(\mathrm{MPa}\) ) |
( ) reference |
0 |
-60 |
3,2 |
14,9.10-3 |
|
0 |
-60 |
4,2 |
79,6.10-3 |