2. Modeling A#
2.1. Characteristics of modeling A#
The modeling studied is HHDen plane deformations. The mesh is composed of 80 Q8 elements.
2.2. Tested features#
This modeling makes it possible in particular to verify the use of the time function PESA_MULT introduced in the map THM_DIFFU. This function is added as a factor of the terms PESA_X, PESA_Y, and PESA_Z, and makes it possible to make gravity dependent on time.
2.3. Results#
The figures below show the profiles of capillary pressures, gas pressures and saturation along the bar for various times. We can clearly observe the rebalancing to reach a steady state (nothing moves after \(\mathrm{0,5}s\)).
In this stationary state and in \(\mathrm{Pa}\):
\(\mathrm{Pgz}(x=0)=\mathrm{0,991}\mathrm{Pa}\) and \(\mathrm{Pgz}(x=3)=\mathrm{1,014}\mathrm{Pa}\)
\(\mathrm{Pc}(x=0)=\mathrm{22,8}\mathrm{Pa}\) and \(\mathrm{Pc}(x=3)=-\mathrm{6,62}\mathrm{Pa}\)
This gives \({\mathrm{\Delta P}}_{\text{lq}}=\mathrm{29,44}\mathrm{Pa}\) which corresponds well to the hydrostatic balance.

Figure 2.3-a : capillary pressure profiles

Figure 2.3-b : gas pressure profiles
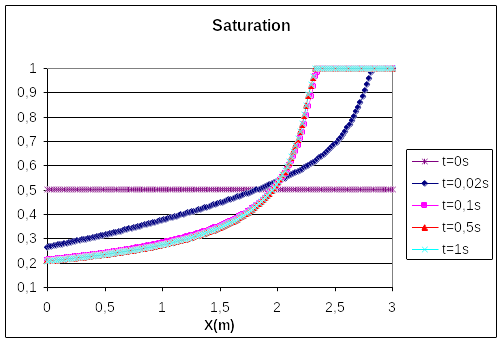
Figure 2.3-c : saturation profiles
2.4. Tested value#
\(X(m)\) |
Time \((s)\) |
|
Relative error allowed |
0.02 |
13.94 |
|
|
0.1 |
21.92 |
|
|
1 |
22.79 |
|