2. Modeling A#
2.1. Characteristics of modeling A#
Modeling HHS in plane deformations. Coupling LIQU_GAZ. 100 elements QUAD8.
Discretization in time:
\(\mathrm{1000s}\) in 20 steps of time
\(5000s\) in 20 steps of time
\(10000s\) in 10 steps of time
\(50000s\) in 20 steps of time
\(100000s\) in 20 steps of time
2.2. Results#
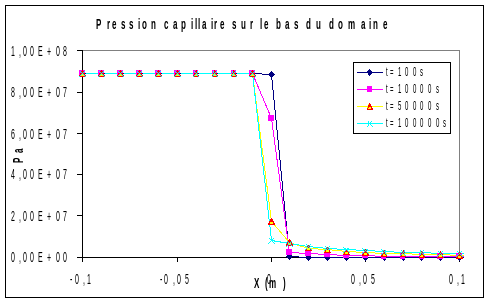
The figures below show the profiles of gas pressures, capillary pressures and saturations along the bi-material at various times:
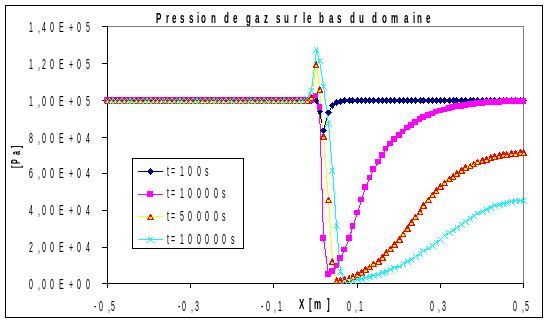
The desaturation of the geological barrier by the engineered barrier is well observed. Gas pressure profiles are also characteristic of this type of problem: a peak in gas pressure is observed at the interface of the two materials, which is due to the fact that the gas is compressed by water, which restores the engineered barrier. While the existence of this peak has a physical reality, its magnitude is on the other hand due to a numerical schema problem (known problem) as we will see for modeling \(C\).
The oscillations observed on the saturations are also well known (we will refer to [1]). In fact, materials are defined by the elements and not by the nodes. This means that on a node located at the interface, 2 capillary pressure curves are defined and different. This point explains that while capillary pressure continuity is ensured, the same is not true for saturation.
2.3. Tested values#
This test case has no reference value, so we make it a non-regression case.
Tests are carried out on two values:
\(X\) ( \(m\) )) ** |
Time (:math:`s`**) ** |
:math:`mathrm{PRE1}`**Aster** |
Relative error allowed |
\(0.03\) |
|
|
|
\(0.03\) |
|
|
|