4. B modeling#
4.1. Characteristics of B modeling#
Modeling THHD in plane deformations. 80 elements \(\mathit{Q8}\)
4.2. Results#
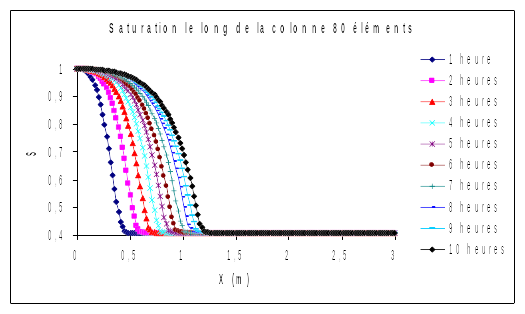
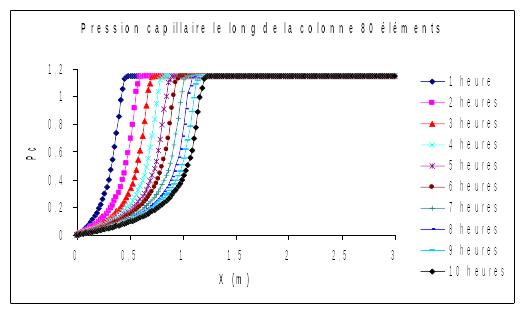
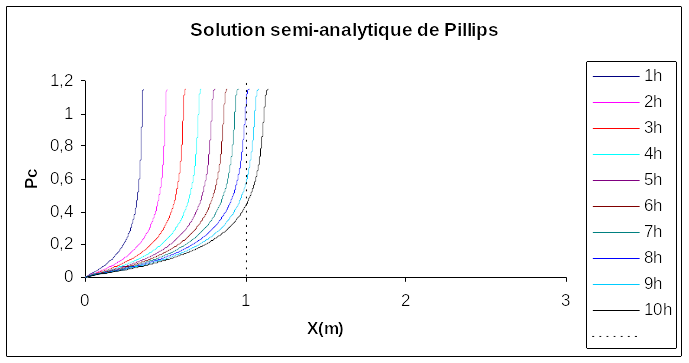
The table below shows the capillary pressure and saturation profiles along the bar and at each hour, as for modeling A, the semi-analytical Phillips solution is intercalated:
4.3. Tested value#
\(X\) ( \(m\) ) |
Time ( \(s\) ) |
\(\mathit{PRE1}\) Aster |
Capillary Pressure (Phillips) |
Relative Error |
Relative Error |
36000s |
0.459 |
0.459 |
0.460 |
|